Expanding Solar System Resonance Theory (ESSRT) — Earth’s Clock Through Deep Time
Earth’s clock — the mean lunisolar precession period, and every spin quantity that rides it (the obliquity beat, the precession-band climate lines) — is not a fixed constant. It lengthens monotonically over geological time, driven by Earth-Moon tidal evolution: tides slow the spin and the receding Moon’s torque weakens. The orbital quantities follow standard secular dynamics instead: the planets’ modes, the eccentricity-band climate lines and the 405-kyr metronome do not follow Earth’s spin — their only long-term drift is the solar-mass tier. This page is the synthesis of the time dimension.
This page establishes:
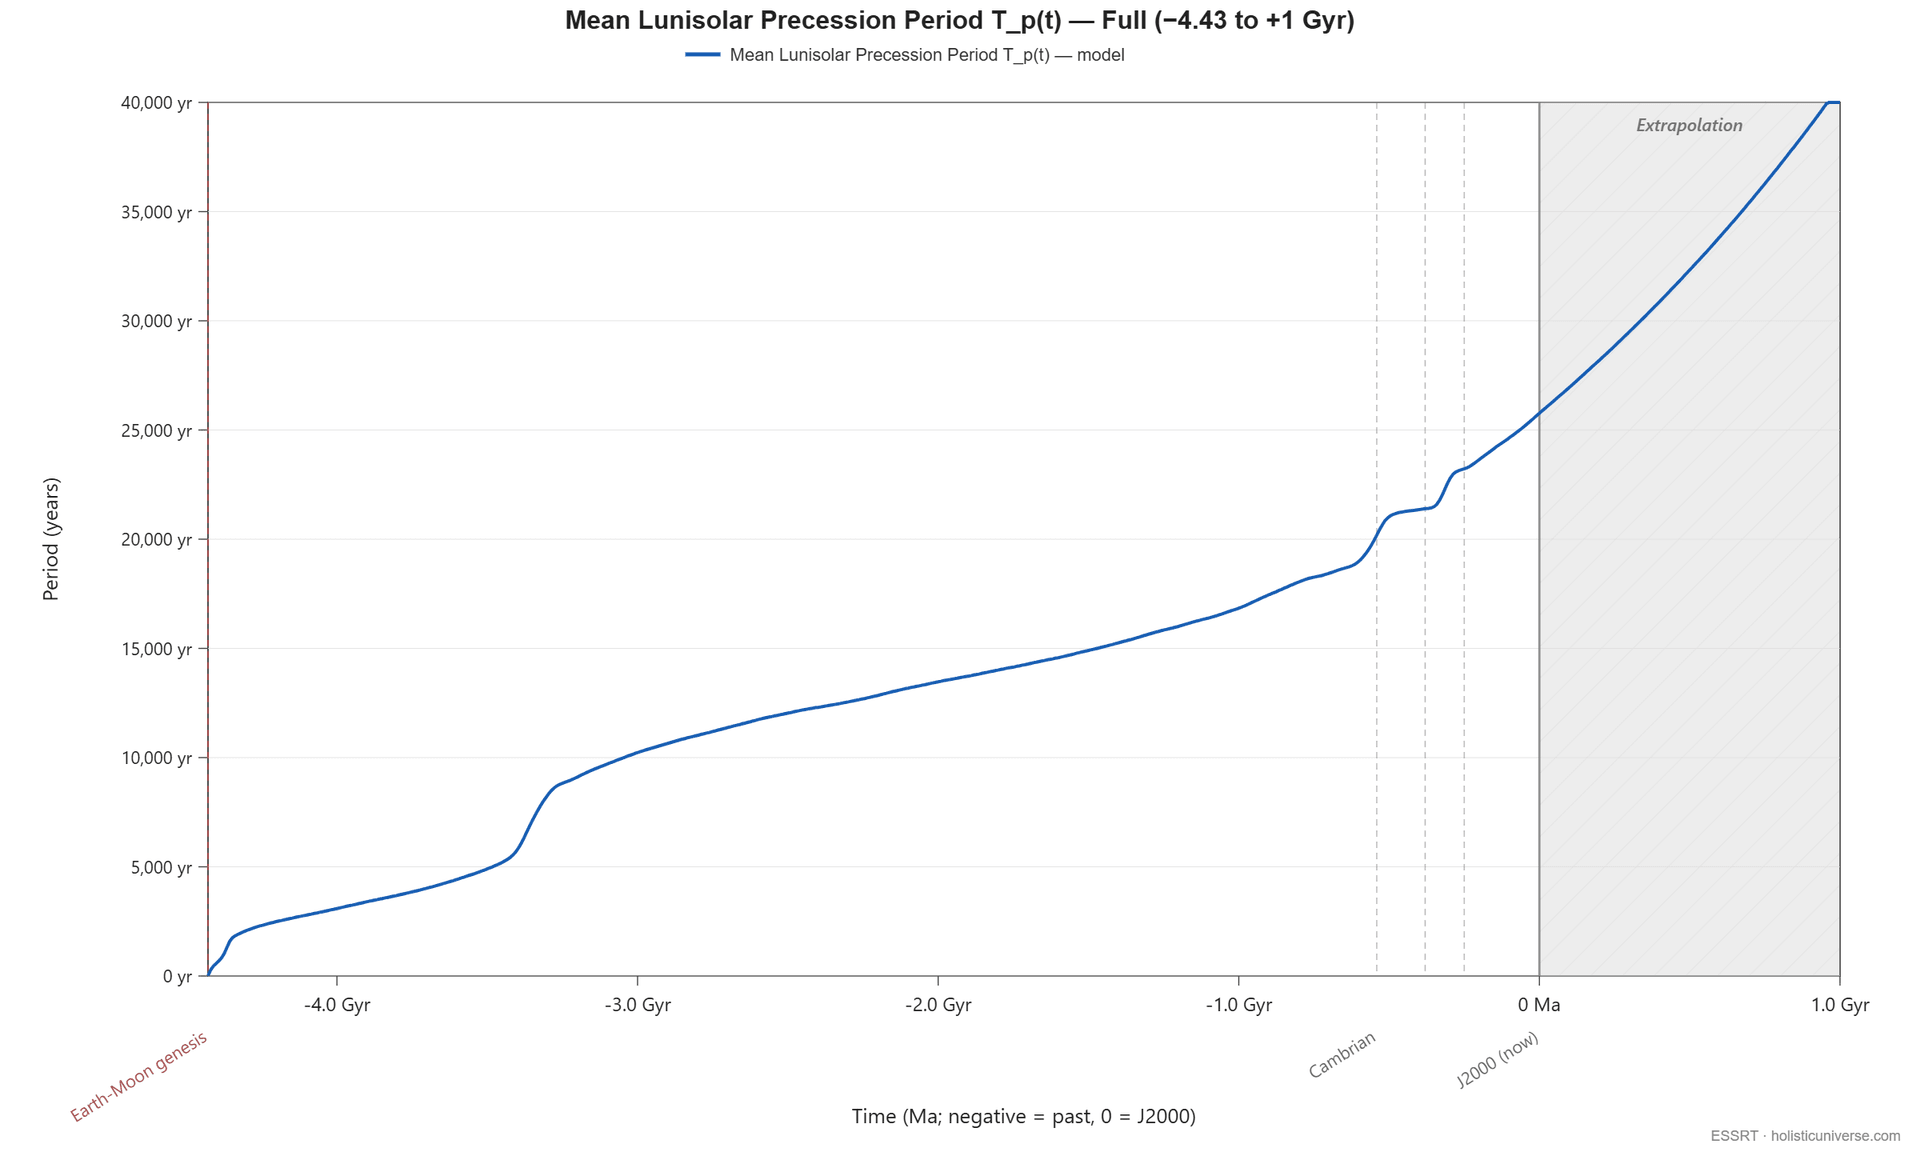
- The clock was ~21,235 yr at Devonian (380 Ma); today it is 25,771.6 yr; in 200 Myr it will be ~28,315 yr — What expands, and what stays the same, Two drivers, two physical processes.
- It shortens monotonically into the past — ~16,584 yr at 1 Gyr ago — and collapses to a few years at the end of the distance history (4.429 Gyr ago, the Moon at 6.19 Earth radii). That collapse is the composition law at the edge of the input’s domain, not a measured period. The far-future limit is tidal lock — The Earth-Moon genesis, The asymptotic future.
- The Moon’s distance history is a cited input, not a fit. The model cannot derive how fast the Moon receded in each era — that needs an ocean-dissipation history — so it reads the published solution of Farhat et al. 2022 as a physical input, the way it reads the planetary masses, with the lunar-laser-ranging rate as its present-day slope. Everything else is derived from it, and every rock datum is a test — The proper-physics formula.
- Wells 1963’s Devonian coral count of ~400 days/year is met within 1 % (+0.71 %) by the derived 402.83 days/year, with nothing fitted to it — Validation against the geological record.
- For how the clock enters Earth’s climate record — the precession-band lines ride it, the eccentricity-band lines do not — see Climate Formula; for the paleontological day-count tables that validate the time-evolution, see Supporting Evidence; for falsifiable predictions about deep past and far future, see Predictions.
One solar system, two engines, two clocks
There is one solar system and one force. Gravity acts on two different kinds of degrees of freedom, with fundamentally different physics:
- Where bodies go — the orbits. Conservative, nearly time-reversible, no friction: the secular g/s modes, the eccentricity and inclination oscillations, the 405-kyr metronome. Nothing here carries an arrow of time over millions of years.
- How bodies spin and deform — rotation and tides. Dissipative: Earth’s tidal bulge drags, energy becomes heat, the day lengthens, the Moon recedes — irreversibly. Dissipation gives this half an arrow of time the orbital half does not have — which is why the clock evolves.
The model computes each half with its own engine — the spin-and-tides chain for rotation, its own N-body integration for the orbits — and they are not two theories of the same thing but the two halves of one system. The coupling is one-way: the orbits force the spin system (the planets set Earth’s eccentricity and inclination; the Sun and Moon torque Earth’s bulge), and Earth’s spin state feeds nothing measurable back to the planets. Each half carries its own expansion: the tidal tier (Driver 1, fast, Earth-local) and the solar-mass tier (Driver 2, slow, system-wide) — which is what “Expanding Solar System” means after the restatement.
Earth is the interface, the one body where both halves meet at full strength — a massive moon, a fast spin, and a climate record that writes both halves into rock (the integer ratios once read between Earth’s periods are retired — Earth’s Clock).
The composition of the two halves is what nature measures. Earth’s physical axial-precession rate at age t composes both engines — the spin engine’s ω(t) and lunar-recession history carrying the lunar torque, the orbital side the solar torque (solar share today 31.6 %):
| age | the two engines composed, ψ̇(t) = [ω/ω₀]·p₀·[f_S + (1 − f_S)(a₀/a_M)³] (″/yr) | external reading |
|---|---|---|
| J2000 | 50.2880 | IAU: 50.29 (measured) |
| 650 Ma | 70.3 | Wu et al. 2024: 67.64 (cyclostratigraphic inference) |
| 1400 Ma | 86.5 | Meyers & Malinverno 2018: 85.79 ± 2.72 (Xiamaling; cyclostratigraphic inference, +0.87 %) |
| 2460 Ma | 109.2 | Lantink et al. 2022: 108.6 ± 8.5 (Joffre; cyclostratigraphic inference, +0.59 %) |
The independently inferred rate at 650 Ma sides with the composition to 0.2 % — a number the orbital engine cannot produce alone (it knows nothing of Earth’s day length). At 1.4 and 2.46 Ga the composed rate sits inside the published 1σ of both Precambrian precession constants. A clock scaling with the day length alone misses the 650 Ma reading by 9 ″/yr and the Precambrian constants by 24 % and 35 %. The composed period is the clock the obliquity dynamics precess on and the paleo-anchor gate checks. (The model column is theory; Wu’s rate is inferred through an assumed astronomical model; the IAU J2000 rate is the measured anchor. Full derivation: doc 99 in the 3d repository .)
1. What expands, and what stays the same
Earth’s long periods fall into two tiers, and the split is the theory’s central claim:
- Spin quantities ride the clock. The precession period itself, and every beat of the precession rate with an orbital motion — the obliquity beat 2π/(ψ̇ − |s₃|), the climatic-precession lines, the perihelion-of-date period. As the clock lengthens these move with it; the beats move faster than the clock, because their orbital partner (the nodal mode s₃, the planetary apsidal modes) does not follow Earth’s spin.
- Orbital quantities do not. The planets’ apsidal and nodal eigenfrequencies, the eccentricity-band climate lines they beat into, and the 405-kyr metronome are set by the planets’ masses and distances. Their only long-term drift is the solar-mass tier of §2.
| Quantity | Modern | Devonian (380 Ma) | +200 Myr future |
|---|---|---|---|
| Earth axial precession (the composed lunisolar period) | ~25,772 yr | 21,235 yr | 28,315 yr |
| Obliquity beat 2π/(ψ̇ − |s₃|) | 41.1 kyr | 30.6 kyr | 48.0 kyr |
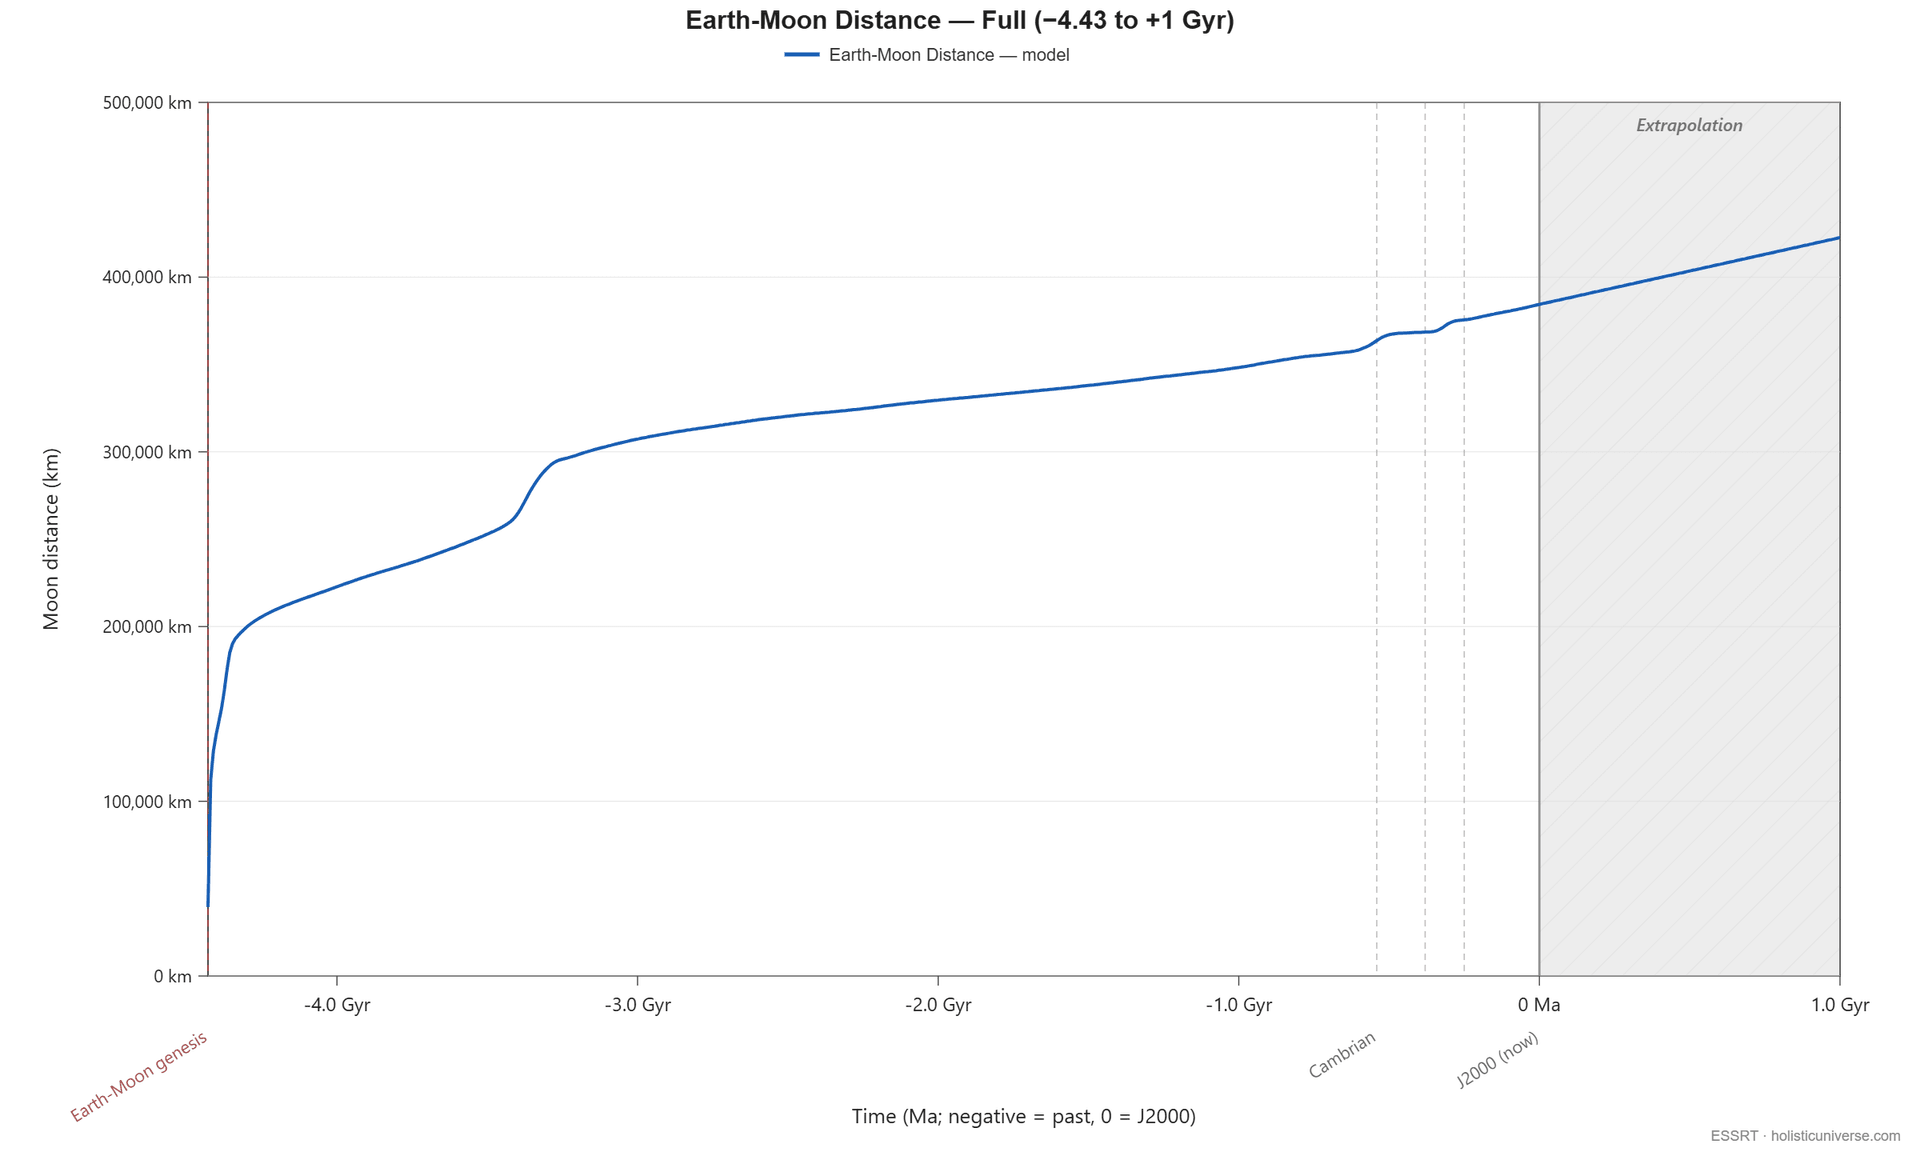
| Moon-Earth distance | 384,399.07 km | 368,549 km | 392,039 km |
| Planetary eccentricity beats (e.g. the 405-kyr metronome) | 405.6 kyr | 405.6 kyr (solar-mass tier only) | 405.6 kyr |
The clock and the Moon’s distance move together; the obliquity beat moves faster; the planetary beats stay put. A useful intuition for the rate: one billion years ago the clock was about ~64 % of its current length. The growth is slow on geological timescales but cumulative over the planet’s lifetime.
2. Two drivers, two physical processes
The expansion is driven by two independent physical processes that act on different parts of the system. They produce complementary effects on the clock.
Driver 1 — Earth-Moon tidal evolution
The Moon raises a tidal bulge on Earth. Earth’s rotation drags that bulge slightly ahead of the Moon-Earth line. The misalignment creates a torque that slows Earth’s rotation and transfers angular momentum to the Moon’s orbit, pushing the Moon farther out. Modern lunar laser ranging measures the recession at 3.82 cm/yr (Dickey 1994 / Chapront 2002 — the present-day slope of the model’s distance history); the long-term Phanerozoic average from Wells 1963 coral data is ~3.43 cm/yr, the natural time-average of the LLR rate integrated across ~500 Myr of Earth-Moon evolution.
As Earth’s rotation slows, the day grows longer (LOD increases), and the precession rate — proportional to the spin — falls. The receding Moon weakens its torque on Earth’s bulge as the inverse cube of its distance, and the lunar torque is two-thirds of the total today. So Driver 1 lengthens the clock, and every spin quantity with it:
Moon recedes → LOD grows and the lunar torque weakens → the precession period grows → the obliquity beat and the precession-band climate lines grow with itThis is the dominant driver in fractional terms. At Devonian the clock read ~21,235 yr against ~25,772 yr today; the change comes entirely from Driver 1.
Driver 2 — Solar mass loss
The Sun loses mass through electromagnetic radiation (mass-energy via L_☉ / c²) and the solar wind, at a combined rate of about 9.3 × 10⁻¹⁴ of its mass per year. For each planet in orbit around a slowly-shrinking central mass, the adiabatic invariant a × M_☉ ≈ constant predicts the orbit expands as M_☉ decreases. Going to past, the Sun was more massive, so every planet’s orbit was smaller.
Every planet drifts by the same fractional amount. At Devonian, the entire solar system was ~35 ppm tighter — Mercury was at 57,907,130 km (now 57,909,176), Jupiter at 778,519,688 km (now 778,547,200), Neptune at 4,503,284,523 km (now 4,503,443,661); every distance moved by the same proportional amount. At Hadean, ~422 ppm tighter. Driver 2 rescales the orbits uniformly. Planet orbit ratios, and the ratios between the planetary secular modes, are preserved across all epochs.
Driver 2 makes the 405-kyr metronome a scale that weighs the ancient Sun. Under adiabatic mass loss every Newtonian secular frequency scales with the solar mass at first order — g, s ∝ M_☉, the Laplace–Lagrange result. The model measured the response beyond first order by ramping the Sun’s mass inside its own N-body integration. The planets’ own modes obey g ∝ M to 10⁻⁴, but g₅ and g₆ carry a Great-Inequality-amplified second-order share (~12% and ~10%) that is mass-independent. So the famous 405-kyr eccentricity cycle’s period responds as M_☉^−1.153 rather than exactly 1/M_☉. The practical reading is unchanged — a 1 % heavier young Sun makes the “405-kyr” cycle ~401 kyr at that epoch.
Reading precisely dated Precambrian strata against this scale gives the first rock-based measurement of the ancient Sun’s mass: μ(2.48 Ga) = M/M₀ = 1.00 ± 0.07. That is the Kuruman count-bracket inversion, sedimentation-rate-free and quoted through the conservative first-order slope; the measured exponent would tighten it to ±0.061. It belongs to the model’s two-expansions programme, with instruments in the 3d repository . The bound is consistent with a constant-mass Sun and closes the massive-young-Sun window above ~14 % at 2σ; sharper zircon dating of the same sections is the route to a few-percent weighing.
A methodological finding rides with it. Every published deep-time cyclostratigraphic chronology assumes μ = 1 implicitly, because the 405-kyr cycle is used as the reference chronometer. Tidal-rhythmite and growth-band anchors, which count physical days directly, are therefore the μ-independent class — and the model’s deep-time calibration validates on that class alone.
The recession history is a cited input
How fast the Moon receded in each era depends on how much tidal energy the oceans dissipated, and that depends on the continents, the ocean basins and their resonances — physics the model does not carry. So the Earth–Moon distance history is a cited input: the published ocean-tide solution of Farhat et al. 2022 (the AstroGeo22 ephemeris, 0–4,429 Ma), read as a shape on the observed present-day distance with the lunar-laser-ranging rate as its present-day slope. Farhat’s solution carries the resonant history — long slow-recession stretches between ocean-resonance crossings, with a marked step at 3.35 Ga and the Moon’s rapid early recession in the first tens of million years. The model adds no term of its own to it: no polynomial, no fitted regime, no solar angular-momentum channel. The day length is angular-momentum conservation on that history with the present Earth–Moon total held constant.
The consequence is that the geological record becomes a test rather than a calibration. Every published day count, tidal rhythmite and cyclostratigraphic precession constant is read against the derived chain by the public repository’s paleo gate on every change, and the deviations are reported as bands with their cause named. The Phanerozoic coral counts sit within ±1.4 %; the Mesoproterozoic precession constants of Zhou et al. 2024 sit 3–7 % above the chain (1.7–3.6σ) — the stated open discrepancy, which may be the cited history’s or the model’s. The validation table is at Supporting Evidence §11. A thermal-tide “day-length lock” in the Proterozoic (Mitchell & Kirscher 2023) is not carried: the recent review by Laskar, Farhat, Lantink and colleagues finds it unsupported once the questionable stromatolite points are dropped; if a dated section ever requires it, it enters through the input’s successor, not as a fitted term.
How the two drivers interact
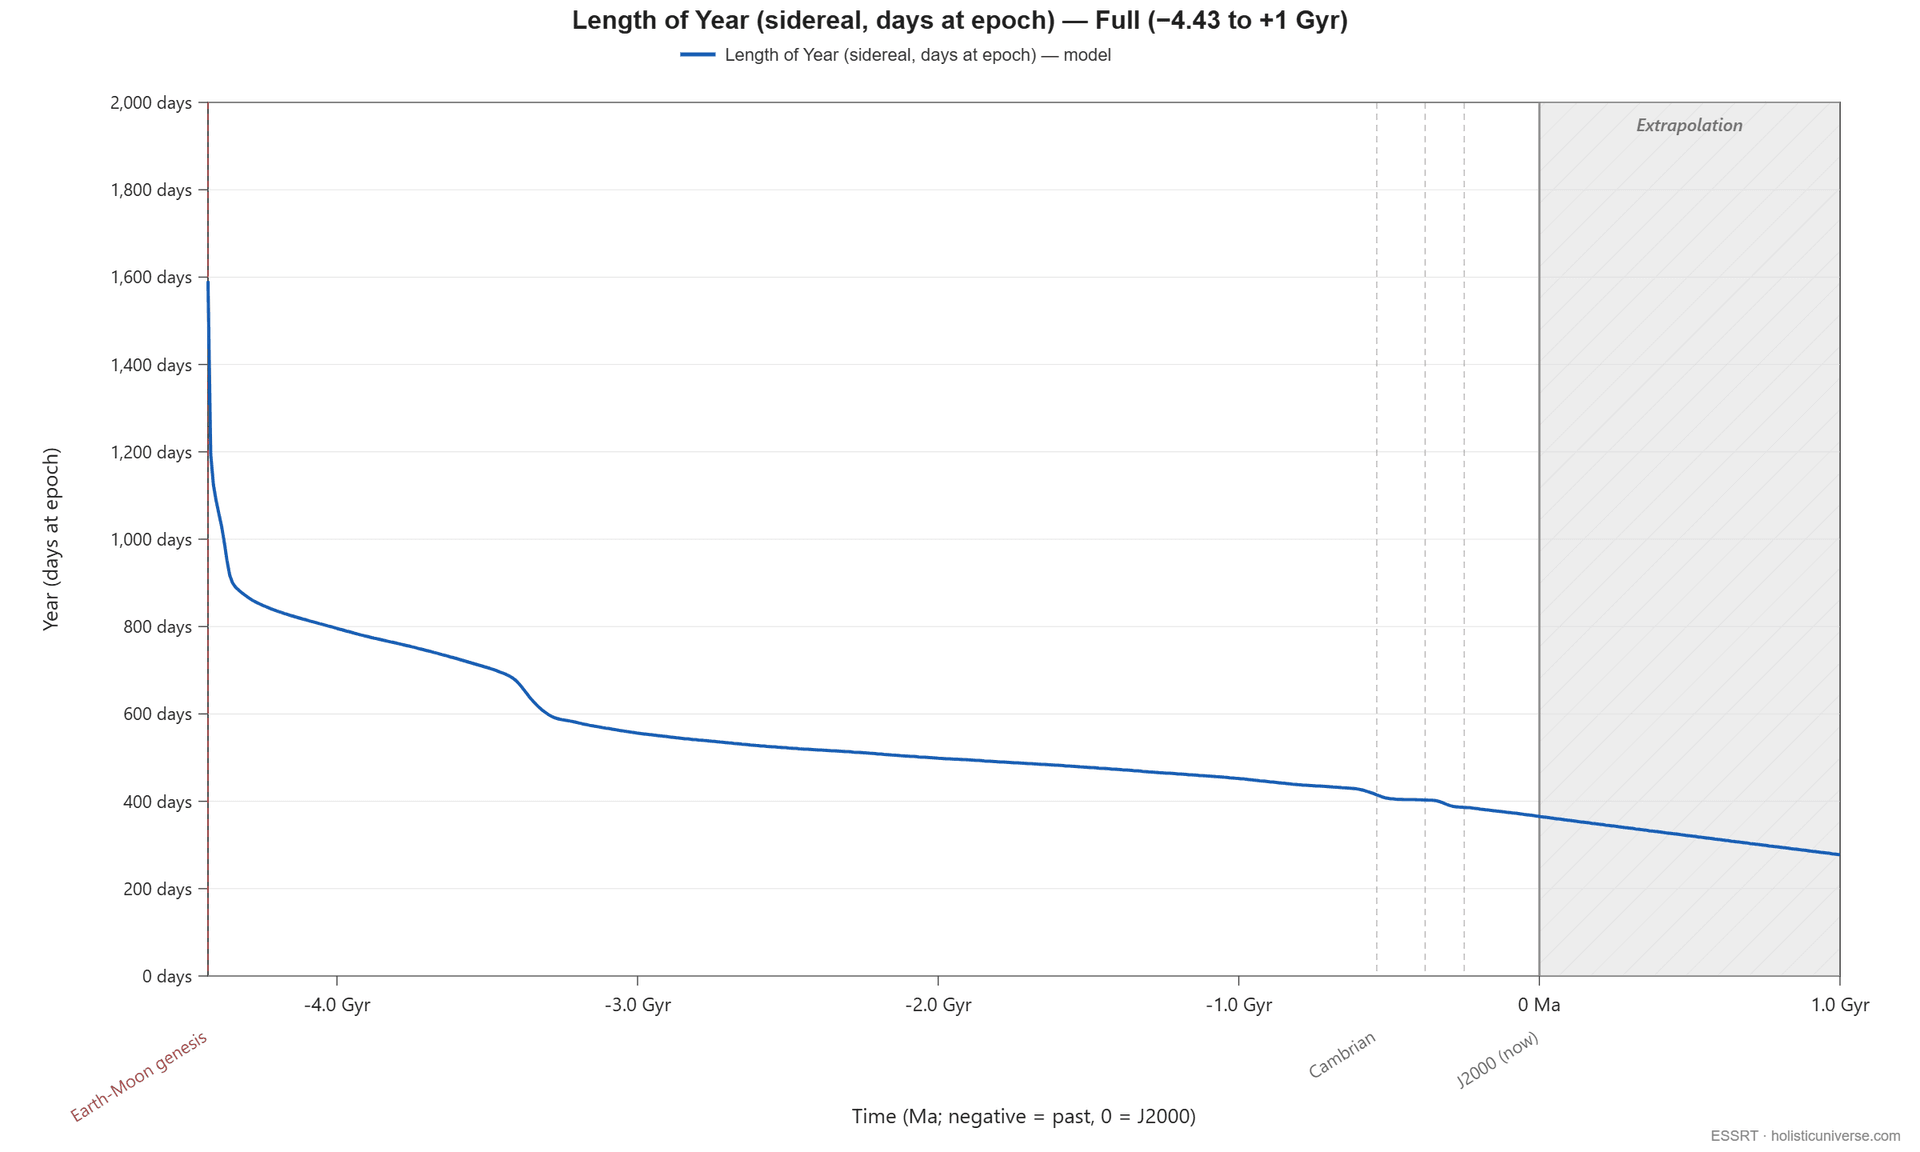
The drivers act on different physical channels — tidal coupling for Earth-Moon angular momentum; gravitational binding for Sun-planet orbits. Both reach the days-per-year count: Driver 1 lengthens the day, and Driver 2 shortens the year in seconds (the Sun was more massive in the past, so by Kepler’s third law the year was shorter). Driver 1 is ~100× larger in fractional terms than Driver 2, so for most paleoclimate purposes Driver 1 dominates the clock’s lengthening and Driver 2 contributes a small Gyr-scale correction.
3. The Earth-Moon genesis — the end of the cited history
If the clock lengthened from past to present, it must have been shorter in the past — perhaps much shorter. How short? Follow the cited distance history back to its end.
The history ends where its authors’ lunar-age input puts the Moon’s formation: 4.429 Ga, the giant-impact age from hafnium–tungsten chronometry (Farhat et al. 2022 adopt 4.425 Ga). At that edge the derived chain reads:
- Moon distance: 39,509 km = 6.19 Earth radii — the input’s last row; the Moon’s first few million years, from the Roche zone outward, lie before it
- Length of day: ~5.51 hours by conservation — inside the canonical post-giant-impact spin range (~4–6 hr); Farhat’s own solution reads 5.8 h there, the 0.3 h being the solar angular momentum his ocean model exchanges and the constant Earth–Moon total does not
- The clock: a few years — the spin is fastest and the Moon closest, so the composed precession period collapses. This is the composition law at the edge of the input’s domain, not a period the model reads off; the last well-behaved deep-time value is ~16,584 yr at 1 Gyr ago. Beyond the history’s end the model refuses rather than extrapolates.
A claim withdrawn. Earlier versions of this page said the model’s recession formula “naturally placed the Moon at the rigid Roche limit at 4.498 Ga with no Hadean constraint in the fit”, and called that its strongest self-validation. It was not a derivation: the crossing was the pinned endpoint of a spline fitted to the rock record, and before that the extrapolation of a polynomial fitted to Farhat’s curve — an echo of the literature’s lunar age through the fit. The right order of events — Earth first (Patterson 1956, 4.54 Gyr), the Moon about a hundred million years later — is the literature’s result, and the input carries it.
The non-coincidence
A structural observation survives the withdrawal. Wells’s tidal rate of 0.00526 hr/Ma was calibrated entirely on Phanerozoic fossil data (0–500 Ma — corals, bivalves, rhythmites). Linearly extrapolated, it predicts LOD = 0 at 24 hr ÷ 0.00526 hr/Ma ≈ 4.56 Gyr ago. Patterson’s Pb-Pb radiometric Earth age is 4.54 Gyr. The two numbers agree to within 0.5 %. It is a signature of averages rather than of the model: the ocean-model history has eras of faster and slower recession that average, over Earth’s lifetime, to the Phanerozoic coral rate. The linear rate is only a Phanerozoic-local approximation — LOD = 0 would mean infinite spin (Earth’s rotational breakup limit is ~2 hr) — and the cited history replaces the period-zero at Earth’s birth with the Moon’s formation at a finite distance and a finite post-impact spin.
4. The proper-physics formula
The model’s LOD(t) and the Moon’s distance — the two inputs of the composed precession rate — are computed by a two-layer formula:
Layer 1 — the Moon-distance history, the cited input:
a_Moon(t) = a_Moon_now × r(t), r(t) = a(t)/a(0) from Farhat et al. 2022 (AstroGeo22), r′(0) = the LLR rateThe ratio r(t) is the published ocean-tide solution over 0–4,429 Ma, scaled onto the observed present-day distance so that the present-day slope is exactly the lunar-laser-ranging recession rate (3.82 cm/yr); forward of today the history has no future, so that rate is held constant — a labelled extrapolation. There is no fitted coefficient in this layer.
Layer 2 — angular-momentum conservation (Earth-Moon system):
LOD(t) = 2π · I_E / (L_total − M_M · √(GM_EM · a_Moon(t)) · √(1 − e²))Given Moon distance, LOD follows from conservation of the Earth-Moon total angular momentum L_total. From LOD and the Moon’s distance every other deep-time spin quantity follows: the composed precession rate and its period, the obliquity beat, the precession-band climate lines, the tidal-lock asymptote.
The chain reads:
- Modern J2000 LOD = 24.000 hr (anchor, exact), recession 3.82 cm/yr (anchor, exact)
- Devonian (380 Ma) LOD = 21.76 hr → days/year = 402.83 vs Wells 1963’s coral count of ~400 (+0.71 %, a documented band on a rounded count)
- Conservation on Farhat’s distance reproduces his own day-length column to 0.01 h at 100 Ma, 0.14 h at 2.46 Ga and 0.3 h at the formation end
- The history’s end (4.429 Ga): Moon at 39,509 km = 6.19 Earth radii, LOD ~5.51 hr
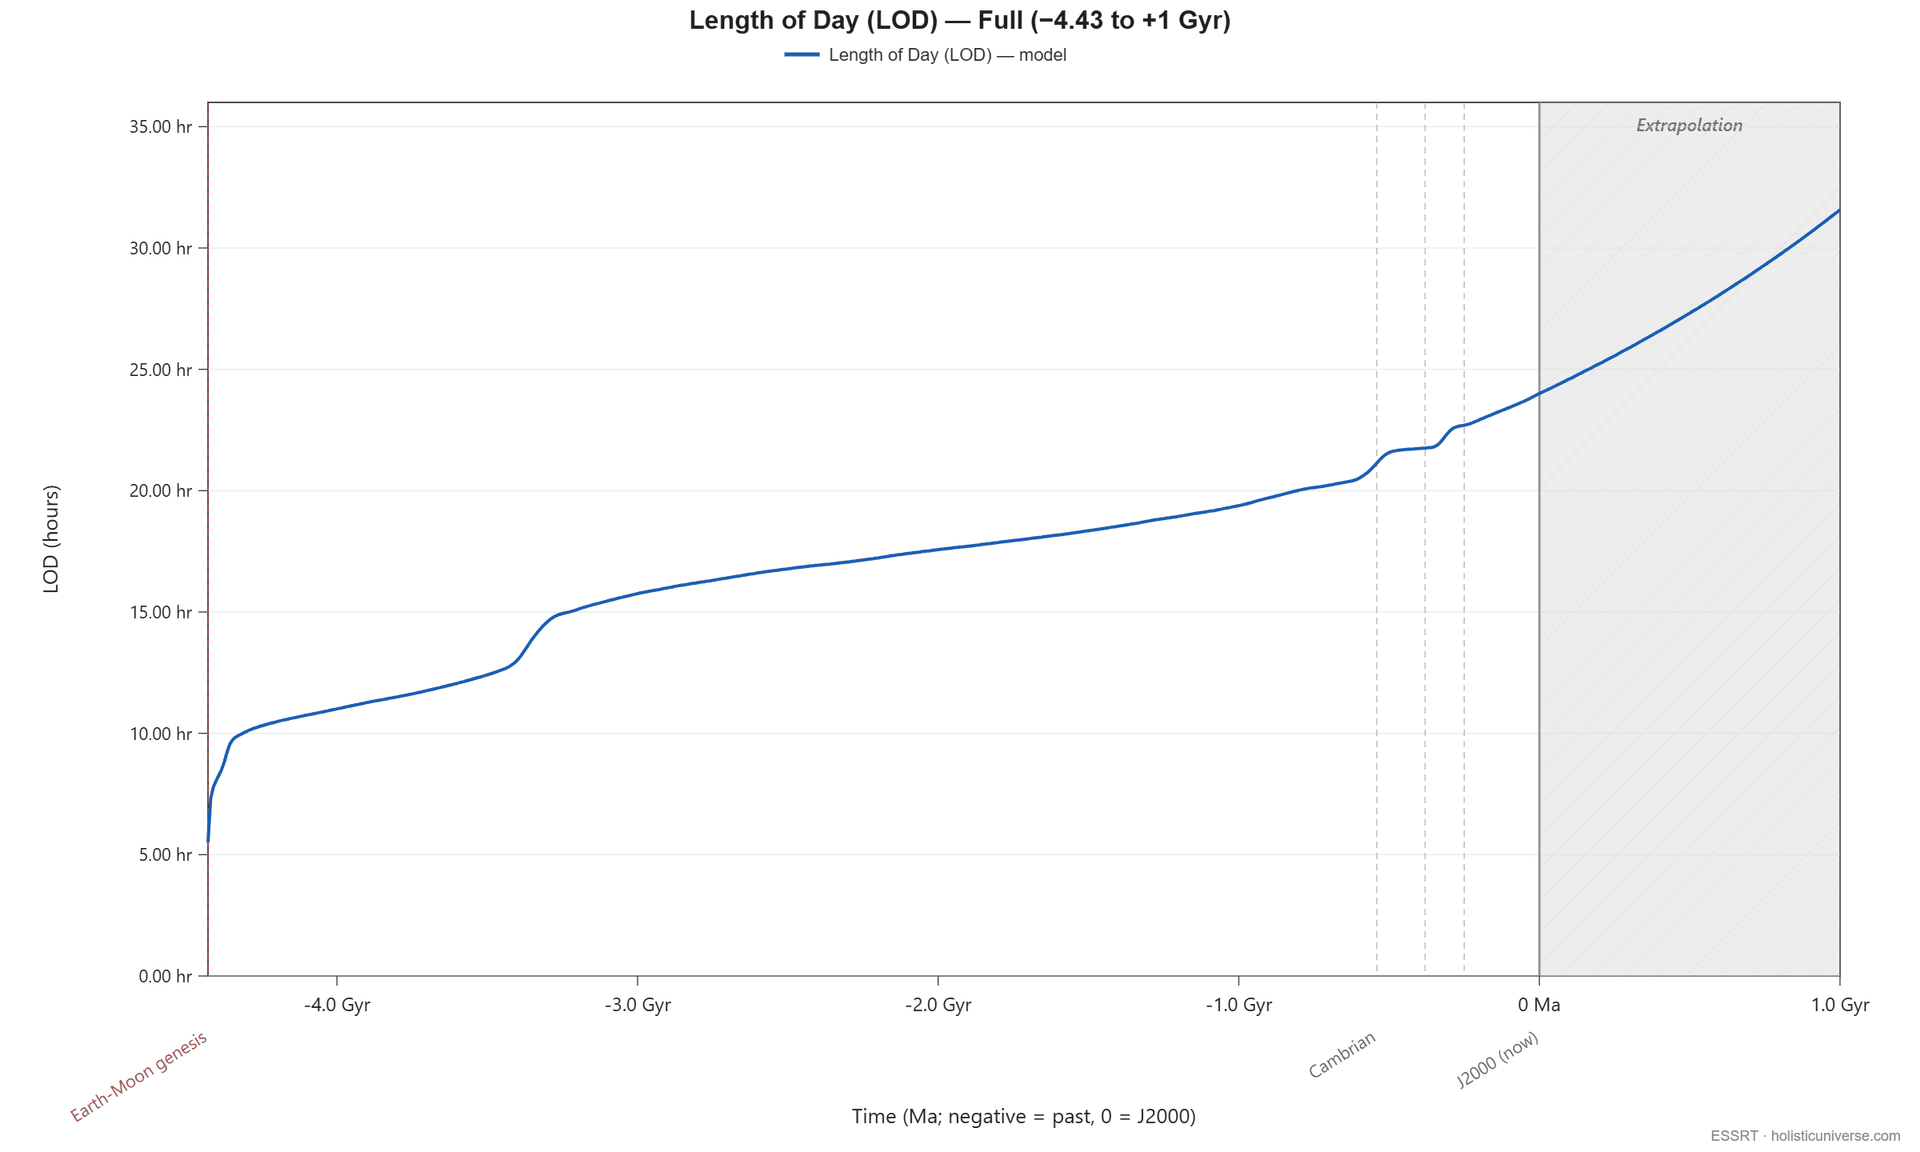
Reading the forward branch. The backward branch is the cited history; the shaded forward region holds the present recession rate constant — future tidal dissipation depends on the evolving ocean-basin configuration, which no published solution carries. The steepening ahead is not new physics: LOD is a period (the reciprocal of spin rate), so dLOD/dt grows as LOD² while the day approaches the tidal-lock asymptote. Because the precession rate is proportional to the spin, the clock steepens in step.
5. Validation against the geological record
The model’s deep-time predictions match the empirical paleo-LOD record across multiple independent measurement techniques.
| Age (Ma) | Source | Method | Observed days/yr | Model prediction | Match |
|---|---|---|---|---|---|
| 0 | IERS modern | Atomic clock | 365.2421905 | 365.2421905 | exact (anchor) |
| 70 | de Winter et al. 2020 | Torreites rudist bivalve | 372 | 371.71 | −0.08 % ✓ |
| 90 | Pannella 1972 / Scrutton | Bivalves (23.5 hr) | 372.6 | 373.36 | +0.20 % ✓ |
| 100 | Wu et al. 2024 | Cyclostratigraphy (TimeOptB Bayesian) | 370.65 ± 2.3 | 374.18 | +0.95 % ✓ |
| 200 | Triassic compilation | Various | 385.9 | 382.50 | −0.88 % ✓ |
| 200 | Wu et al. 2024 | Cyclostratigraphy | 369.87 ± 1.6 | 382.50 | +3.41 % ⚠️ |
| 300 | Wu et al. 2024 | Cyclostratigraphy | 385.31 ± 4.2 | 390.64 | +1.38 % ✓ |
| 380 | Wells 1963 | Devonian corals | ~400 | 402.83 | +0.71 % ✓ |
| 400 | Wu et al. 2024 | Cyclostratigraphy | 403.03 ± 4.6 | 403.20 | +0.04 % ✓ |
| 500 | Wu et al. 2024 | Cyclostratigraphy | 413.48 ± 5.8 | 406.36 | −1.72 % ✓ |
| 620 | Williams 2000 | Elatina tidal rhythmites | 400.3 | 429.37 | +7.26 % ⚠️ |
| 650 | Wu et al. 2024 | Cyclostratigraphy | 418.62 ± 2.0 | 430.90 | +2.93 % ⚠️ |
The directly counted paleontological record (0–380 Ma) is met within 1.4 % with nothing fitted to it (Wells 1963 at +0.71 %, a documented band on a rounded count). The 620 Ma point (Williams 2000) and Wu’s 650 Ma point sit in a known transition interval — the late Cryogenian Snowball Earth boundary — where the cited ocean-model history reads a lower dissipation than the direct rhythmite count and the cyclostratigraphic inversion suggest; both are carried as documented bands. See Supporting Evidence for the full validation discussion.
Wu et al. 2024 — independent 650-Myr cyclostratigraphy reconstruction
The seven Wu et al. anchors deserve special mention because they constitute an entirely independent measurement chain. Wu, Y., Malinverno, A., Meyers, S. R. & Hinnov, L. A. (2024) — “A 650-Myr history of Earth’s axial precession frequency and the evolution of the Earth-Moon system derived from cyclostratigraphy”, Science Advances, doi:10.1126/sciadv.ado2412 — apply a TimeOptB Bayesian inversion to cyclostratigraphic records (Milankovitch-driven sedimentary cycles) across 650 Myr of the Phanerozoic. Unlike paleontology (Wells 1963 coral growth bands, Pannella 1972 bivalves, Williams 2000 tidal rhythmites), Wu’s method does not depend on biological growth-band counting — it derives LOD, Earth-Moon distance, and axial precession rate directly from spectral analysis of climate proxies, with full ±2σ uncertainty propagation at 100-Myr intervals.
The derived chain sits within −1.7 % to +3.4 % of Wu’s six day-count anchors across the 650-Myr range, with a mean absolute residual of 1.7 % and nothing fitted to them. The two largest deviations (200 and 650 Ma) are the places where Farhat’s ocean-model history and Wu’s inversion time the Pangea-era and pre-Snowball dissipation differently — Wu et al. note that Farhat’s acceleration sits ~50 Myr earlier than their data place it. The match at 400 Ma is particularly significant: Wu’s cyclostratigraphy-derived 403.03 days/year sits within 0.7 % of Wells’s 1963 paleontological count of ~400 days/year, and the model reads both within 0.8 %.
Historical eclipses — confirmation across the past 2,700 years
The proper-physics formula also predicts a closed-form ΔT — the deviation between Terrestrial Time and Earth-rotation-tracking Universal Time. Two complementary tests against the documented historical eclipse record confirm the formula:
- Solar-eclipse alignment audit (26 events, -762 BCE to 2026 CE): using the model’s own predicted UT and umbra track (no external ΔT polynomial in the loop), the model umbra reaches the observation site within a ±4-hour scan window for 21/26 events, with 5/26 pure geographic misses — historical attribution debates rather than model errors. The underlying Moon polynomial agrees with NASA’s Five Millennium Catalog within ±15 minutes back to 2,500 years before J2000 (n = 11 canonical events, mean residual 6.9 min). See Solar Eclipse Validation.
- Lunar timing test (267 primary-source observations from Stephenson 2016, -720 BCE to 1280 CE): the higher-resolution test (Babylonian, Greek, Chinese, Arab traditions) reports a mean |residual| of 20.2 min (1,214 s mean |residual|), beating NASA’s Espenak/Meeus polynomial on 117/267 events. Four independent observation traditions agree on the framework’s residual magnitude after detrending. An independent solar cross-validation on 89 events (L-7) matches NASA within one second (664 vs 672 s RMS), beating NASA on 39/89 events. See Lunar Eclipse Validation.
The two tests together resolve a long-standing ambiguity in the eclipse-validation literature. The full Munk-MacDonald-scale (~5-6 ms/century) non-tidal Earth-rotation speedup postulate is rejected by the historical record; a much smaller GIA-scale channel (-0.35 ms/century at J2000) is included via the L1-orbital-coupled α(t) correction. Full derivation of the α(t) physics, the stack decomposition (four cycles + Core-mantle swing), and the out-of-sample Bond 2001 IRD retrodiction lives on Timekeeping and Lunar Eclipse Validation.
6. The Expanding-Universe parallel
The name echoes the expanding universe only in the shape of the claim: a single scale parameter — here the clock T_p (25,771.6 yr today, growing ≈ 0.025 % per Myr) — grows monotonically while the structure it carries survives. The parallel is pedagogical, not physical. Cosmic expansion is metric and universal; this expansion is Newtonian tidal evolution plus the Sun’s mass loss, bounded to the solar system, with its own beginning at the Earth–Moon genesis (4.429 Gyr ago, where the cited distance history ends) and its own asymptote at tidal lock (the Moon at ~555,623 km, ~50 Gyr ahead).
7. The asymptotic future — when does the cycle end?
If the cycle had a beginning at the Moon’s formation, it must have an end at the opposite extreme. The Earth-Moon system asymptotically approaches tidal lock: Earth’s spin period equals the Moon’s orbital period, both at about 47 days in current units. From angular-momentum conservation:
- Tidal-lock Moon distance: 555,623 km = 87.1 Earth radii (currently 60.3 Earth radii)
- Approach timescale: ~50 Gyr (well beyond the Sun’s red-giant phase at +5 Gyr)
- Days per year at tidal lock: ~7.8 (vs current 365.24)
Forward of today the cited history has no future, so the model holds the present recession rate constant — a labelled extrapolation that reaches the tidal-lock distance at about +4.5 Gyr, beyond which the formula returns no value. For longer projections, the angular-momentum boundary itself takes over.
| Phase | Time | The clock (precession period) |
|---|---|---|
| Earth-Moon genesis | −4.429 Gyr | a few years (the end of the cited history) |
| Late Proterozoic | −1 Gyr | |
| Modern (now) | 0 | 25,771.6 yr |
| +200 Myr | +200 Myr | 28,315 yr |
| +1 Gyr | +1 Gyr | ~41,671 yr |
The model’s domain spans about 8.9 Gyr — from the Earth-Moon genesis at −4.429 Gyr to the held-rate horizon at the tidal-lock distance near +4.48 Gyr. The modern epoch sits about 50 % of the way through it. Beyond the horizon the formula returns no value, though the Earth-Moon system continues to exist (and the Sun continues to shine) until the red-giant phase at +5 Gyr.
Future-projection uncertainty
The cited history is a backward record; forward of J2000 the model holds the present recession rate constant. For sub-200-Myr forward projections that is well within accepted tidal-modelling ranges. At +1 Gyr the model’s projected clock of ~41,671 yr corresponds to ~32-hour LOD and ~423,000 km Moon distance — these values sit ~10 % above the predictions of independent tidal models (Bills & Ray 1999, Touma & Wisdom 1994) which predict slower late-future recession as tidal force weakens (∝ 1/r⁶) with Moon distance. A held rate does not capture this physical slowdown. For ratios within the spin tier the difference is irrelevant (every spin period scales together), but for absolute long-term forward use the +500 Myr to +1 Gyr range should be read as an upper-bound estimate, not a precise prediction.
8. Deep-time predictions and retrodictions
The Expanding Solar System Resonance Theory (ESSRT) makes specific testable claims about how the clock evolved and how it will continue to evolve.
- Earth-Moon genesis at the rigid Roche limit — WITHDRAWN. The claim that the recession formula placed the Moon at the rigid Roche limit at 4.498 Ga with no Hadean constraint was a construction, not a derivation (§3). The genesis is the cited history’s end, 4.429 Ga, the literature’s giant-impact lunar age; the model makes no independent claim about it.
- Devonian day count. The model’s Devonian spin state produces 402.83 days/year against Wells 1963’s coral count of ~400 (+0.71 %, nothing fitted to it), with the clock at ~21,235 yr. New high-precision paleontological day-count techniques (e.g., expanded Torreites bivalve sampling) test this reading; a Devonian count resolved better than 1 % decides between the chain and the rounded coral value.
- The two-tier split. Cyclostratigraphic sections at Devonian, Permian and Cretaceous epochs should find the precession-band and obliquity lines shortened on the composed clock (the obliquity beat at ~30.6 kyr in the Devonian against 41.1 kyr today) while the eccentricity-band lines and the 405-kyr metronome stay at their modern periods (up to the solar-mass tier). The precession side is already gated at 1.4 and 2.46 Ga; a section violating either half falsifies the corresponding tier.
- Future tidal-lock asymptote at 87.1 Earth radii. Lunar laser ranging extrapolated forward through full tidal Q-decay should converge on the angular-momentum boundary at 555,623 km Moon distance.
- Cheng cross-proxy persistence. The climate formula’s orbital lines should continue to fit Cheng 2016’s Asian-Monsoon δ¹⁸O record at R² ≈ 0.64 as new high-precision speleothem chronologies extend or refine the record.
- The classical precession of the equinoxes evolves with the tidal history. Earth’s axial precession period (the composed lunisolar period — spin times the torque term) was ~21,235 yr at Devonian and ~16,584 yr at 1 Gyr ago, collapsing to a few years at the end of the cited distance history. Farhat et al. 2022’s own precession column on the same history agrees with the composed rate of date within 0.4 % to 2.46 Ga and 1.3 % at 4 Ga — the rate carries the lower mean obliquity of the deep past through the same cited history’s obliquity column (22.23° at the Devonian, 19.73° at 2.46 Ga), the remaining residual growing only toward formation. The classical observable known since Hipparchus is not a fixed astronomical constant but a now-snapshot of a slowly-evolving cycle. Modern-era rate of change (~6 yr per Myr) is small but in principle observable in high-precision IAU precession-rate measurements over decades. Detail and the deep-time table: Precession §Precession through deep time.
- Lunar precession on a day-length counter — WITHDRAWN. The track tied the Moon’s apsidal and nodal periods to a day-length counter the model no longer carries, and it held only on that counter’s own definition, not in the Moon’s dynamics — see Earth’s Clock.
The model’s canonical list — six numbered entries, each with its falsifier or its status — is in Predictions. Several items above — the Devonian day count and the Cheng cross-proxy fit — are validated retrodictions rather than forward predictions, and are catalogued as such; the Roche-limit genesis is withdrawn.
See also
- Climate Formula — the canonical L1 + L2 + L3 climate formula in detail; its precession-band lines ride the clock
- Supporting Evidence — paleo-day-count validation tables (Wells, Williams, Pannella, de Winter, Cheng)
- Predictions — falsifiable predictions including deep-time claims