Perihelion Precession
Every planet’s perihelion (closest approach to the Sun) slowly rotates around the Sun — perihelion precession. Standard celestial mechanics attributes this to gravitational perturbations from other planets, plus, for Mercury above all, the relativistic advance — and so does the model: Mercury’s stated total is the ecliptic rate plus a derived relativistic supplement (see below). What the model adds is coordinate bookkeeping done exactly: the apparent rates an Earth observer’s equatorial frame produces are exact projections of the ecliptic advances (a gate verifies the decomposition for all seven planets), which matters for reading the simulation’s Earth-frame exports.
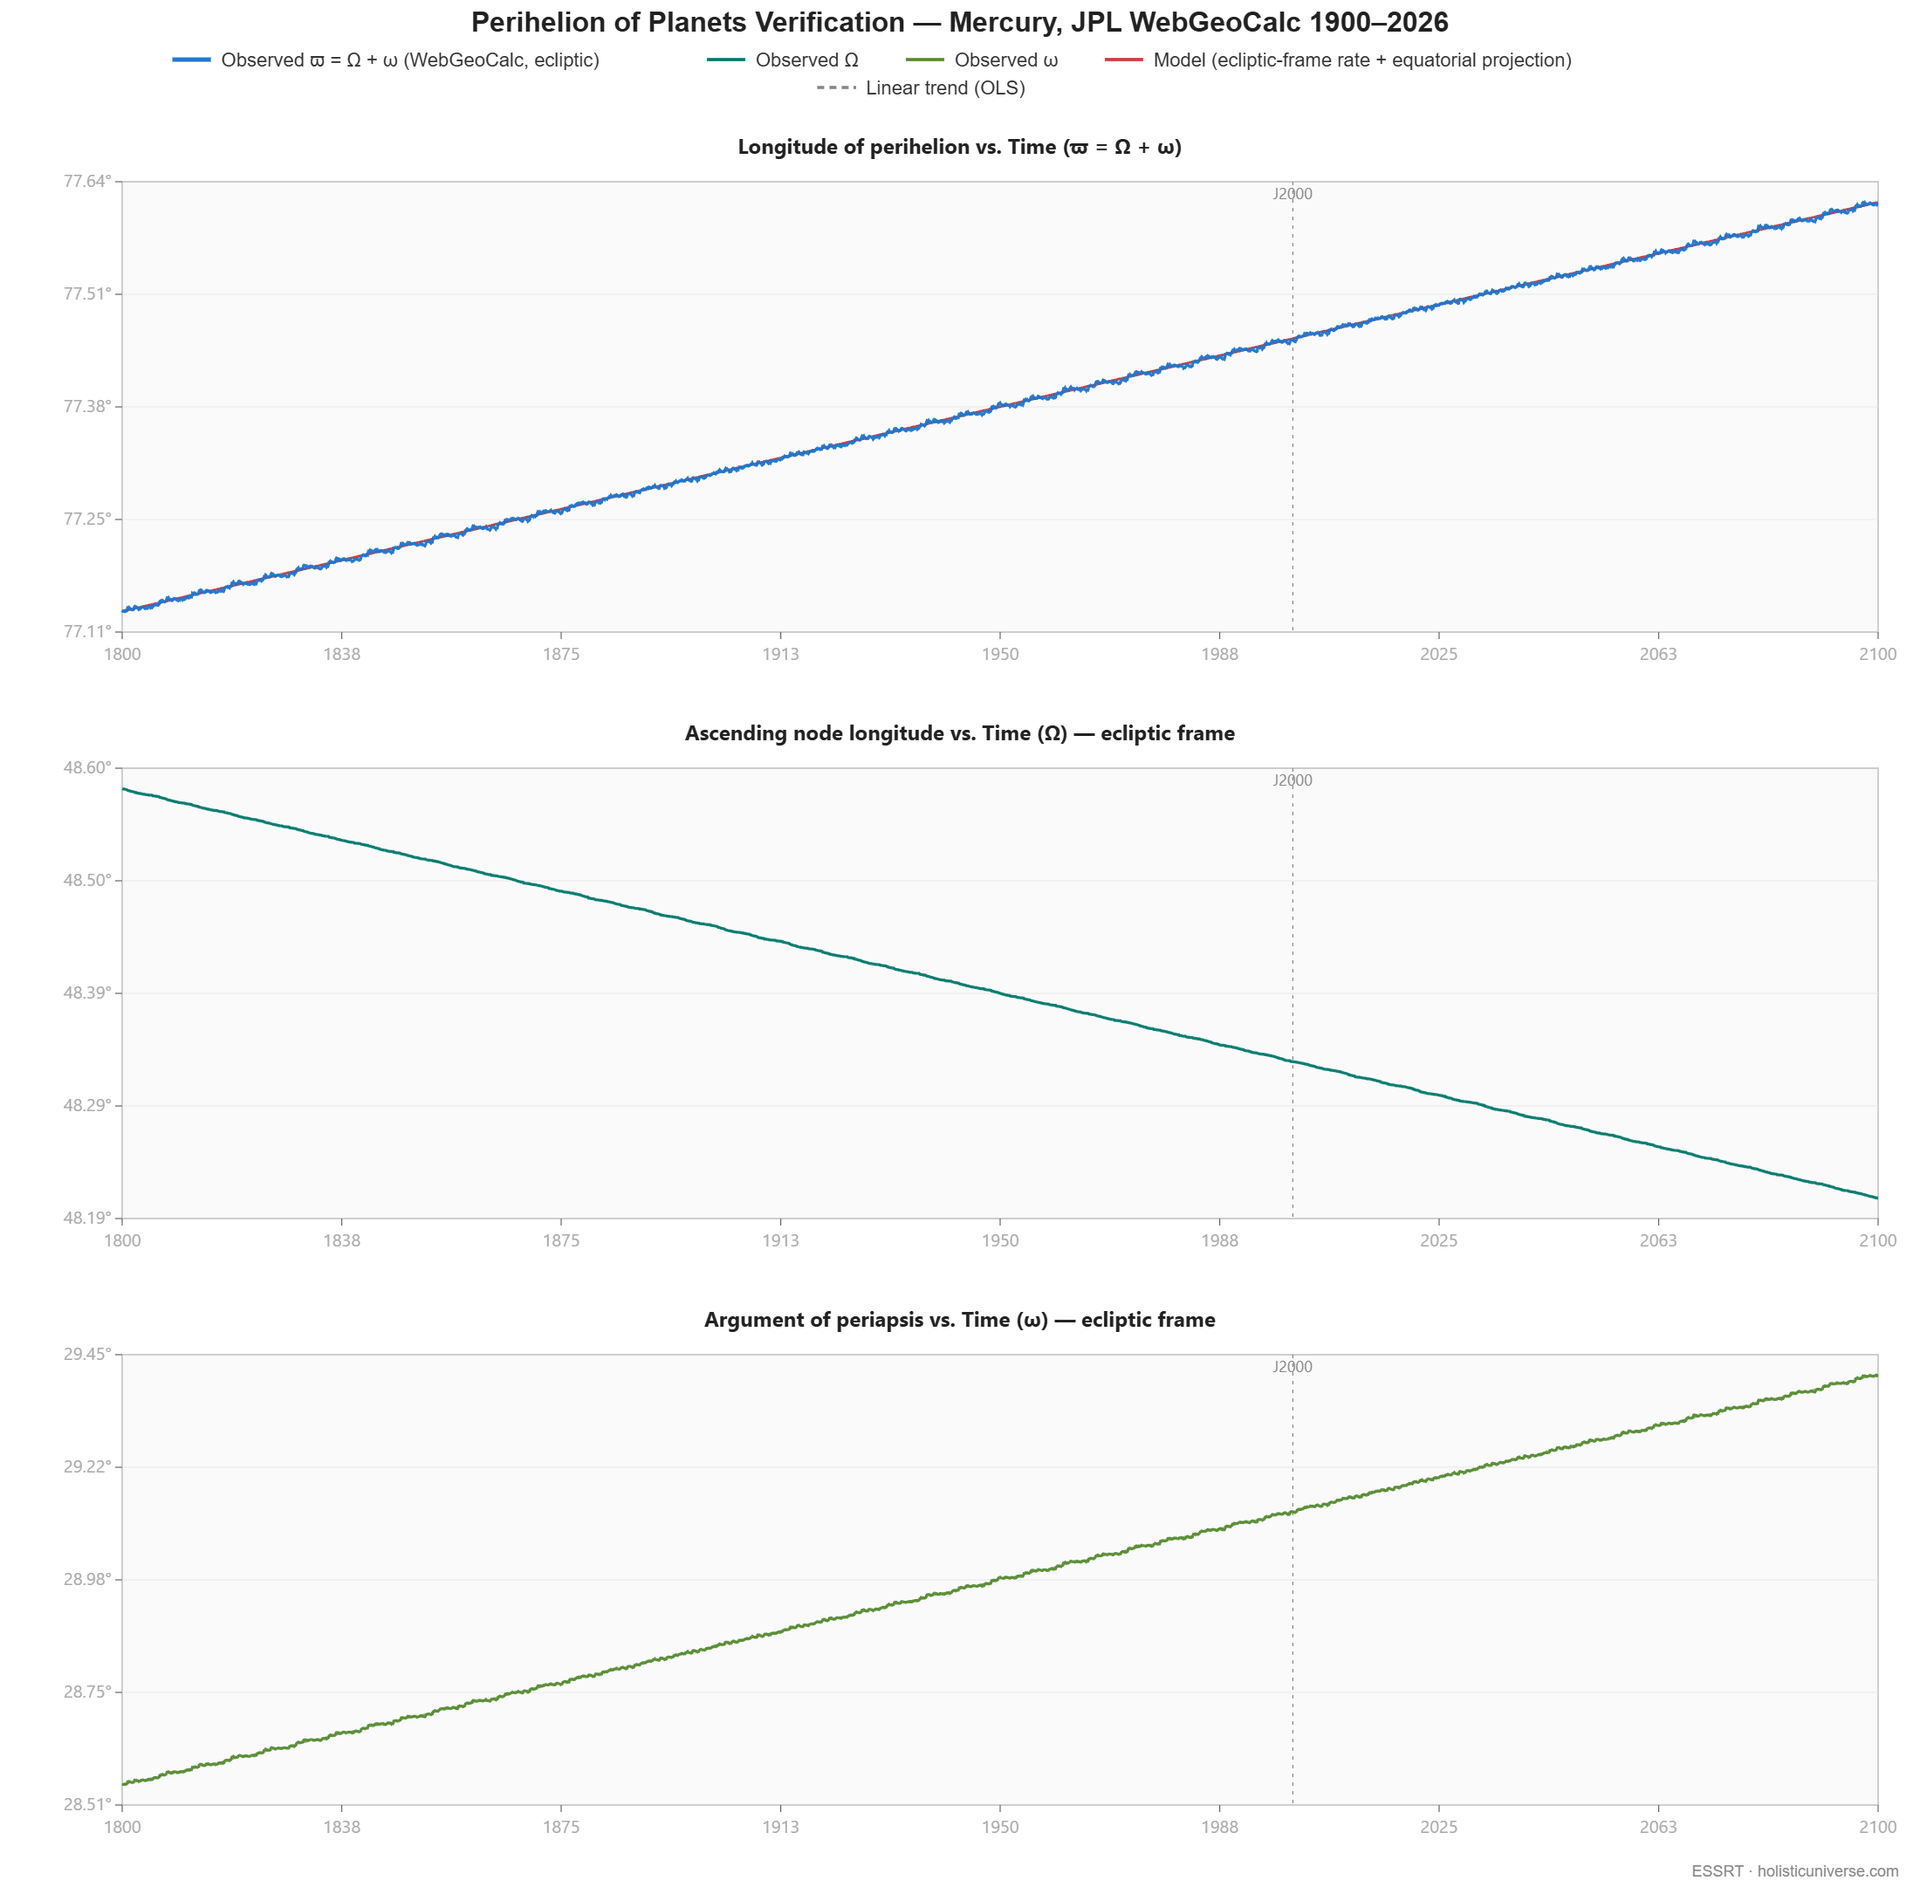
A perihelion rate lives in one of two coordinates, and the two must not be compared with each other: (a) ecliptic longitude — what every observer publishes (relative to the stars, or against the moving equinox of date); (b) right ascension in an equatorial frame — what the simulation’s Earth-frame export measures, which no observer has ever published. The table below keeps them apart: the WebGeocalc trend, Fitzpatrick’s secular value (Standish & Williams 1992) and the Lagrange–Laplace approximation are all (a); the model’s ecliptic rate is (a); the model’s Earth-frame value is (b), shown for completeness only.
This page establishes:
- Mercury’s ~43″/century excess is General Relativity’s, and the model carries the relativistic advance as a derived supplement with zero fitted constants — The Settled Position.
- A perihelion rate lives in one of two coordinates, ecliptic longitude or Earth-frame right ascension, and the two must never be compared — the table below, What the model actually measures.
- The once-proposed projection reading was tested against ranging precision, against all seven other planets and against the model’s own N-body engine, and closed — The verdict.
- BepiColombo is the consistency check the model shares with General Relativity, and sharpens the solar-oblateness separation — BepiColombo: The Second Ranging Epoch, Solar Oblateness Uncertainty.
- Every planet’s apparent Earth-frame rate is an exact projection of its ecliptic advance, a gated identity — Perihelion Precession Across the Solar System.
| Planet | WebGeocalc at J2000 (″/cy), (a) | Model ecliptic rate (″/cy), (a) | Model Earth-frame RA at J2000 (″/cy), (b) | Fitzpatrick (″/cy), (a) | L-L Theory (″/cy), (a) |
|---|---|---|---|---|---|
| Mercury | ~572 | 529.0 | ~576 | ~575 | ~554 |
| Venus | ~0 | 14.1 | ~4 | ~205 | ~1,207 |
| Earth | ~1,164 | 1,160.9 | — | ~1,145 | ~1,279 |
| Mars | ~1,600 | 1,596.5 | ~1,497 | ~1,628 | ~1,775 |
| Jupiter | ~1,800 | 488.5 | ~458 | ~655 | ~751 |
| Saturn | ~-3,400 | -1,576.7 | ~-1,718 | ~1,950 | ~1,859 |
| Uranus | ~1,100 | 806.6 | ~740 | ~334 | ~275 |
| Neptune | ~200 | 9,101.7 | ~8,872 | ~36 | ~67 |
WebGeocalc = JPL ephemeris 1800–2000 trend, ecliptic longitude (a). Venus reads ~0 because its observed perihelion motion flips sign across sub-windows, so the trend averages out — the one planet the window cannot resolve. Model ecliptic rate = the N-body chain’s own Newtonian window rate over 1800–2100, ecliptic (a). Model Earth-frame RA = that rate projected into the simulation’s equatorial frame plus the obliquity-rate term (b) — the quantity the Earth-frame export and the predictive formula produce; it is not an observable and is not fit to WebGeocalc. Fitzpatrick = long-term secular average (Standish & Williams 1992). L-L Theory = analytical first-order approximation (Lagrange–Laplace, 19th century).
Why these values differ. In the observers’ coordinate (a) the model’s ecliptic rate sits at the Newtonian value for Mercury (529.0 vs ~532) and the WebGeocalc trend is ~42.98″/cy above it — the anomaly. The Earth-frame RA column (b) is larger by the equatorial projection and must not be read against the WebGeocalc column. The two theory columns disagree because they answer different questions.
Fitzpatrick — long-term secular. Averages interplanetary gravitational pulls over many orbits (Gauss’s ring-averaging method via Standish & Williams 1992). By construction it smooths out the short- and medium-period oscillations visible in WebGeocalc data — most notably the ~900-year Jupiter–Saturn Great Inequality.
L-L Theory — analytical first-order. A 19th-century closed-form formula (Fitzpatrick Celestial Mechanics Table 5.1) treating other planets as concentric coplanar rings. Omits General Relativity (Mercury misses ~43″/cy), higher-order Newtonian terms, and resonances. Venus’s tiny eccentricity makes the formula numerically unstable. The N-body Newtonian baseline used below (Mercury ~532″/cy) is more accurate.
For Saturn’s ecliptic-retrograde trend the model’s own N-body engine agrees with the standard mechanism: the retrograde is the window phase of the ~900-year Jupiter–Saturn Great Inequality, with the long-term mean prograde (g₆) — so the chain’s retrograde window rate for Saturn is a window-epoch reading of the present era’s motion. See Supporting Evidence §9.
Heads-up. Mercury’s WebGeocalc 1800–2000 trend (~572″/cy) is ~3″/cy below the canonical ~575″/cy used in the textbook anomaly story below. The standard “anomaly = 575 − 532 = 43″/cy” equation needs the higher figure. The ~575 comes from MESSENGER’s 2013 spacecraft snapshot at J2000; whether that’s a stable long-term rate is exactly what BepiColombo (2027) will test.
The Mercury “Anomaly”
Mercury’s perihelion precession is historically significant because of a famous discrepancy debated for over a century.
| Measurement | Relative to fixed stars (ICRF, modern ranging) | Relative to the moving equinox of date (classical, Clemence 1947) |
|---|---|---|
| Total precession | ~575″/century | 5,599.74″/century |
| Newtonian prediction | ~532″/century | 5,557.18″/century |
| Discrepancy | ~43″/century | 42.56 ± 0.94″/century |
Both columns describe the same physical motion in the ecliptic plane — the difference is the reference direction. The classical column is measured against the moving vernal equinox, which the equinox precession (~5,026″/century in the Newcomb constant system Clemence used) carries backward; the ICRF column is measured against the fixed stars. The equinox precession cancels in the subtraction, which is why the ~43″ discrepancy comes out the same in both frames. Each column is a complete determination inside its own constant system and epoch — the two totals are not inter-convertible by adding the modern precession rate to the ICRF value; no equinox-referred determination has been made in the modern system, and the subtraction must stay inside one column.
Origin of the ~532″ Newtonian prediction
The ~532 arcseconds/century Newtonian prediction comes from gravitational perturbations by all other planets. Since Mercury is the innermost planet, every other planet pulls its perihelion forward (prograde):
| Planet | Contribution | Percentage |
|---|---|---|
| Venus | ~278 arcsec/century | ~52% |
| Jupiter | ~154 arcsec/century | ~29% |
| Earth | ~90 arcsec/century | ~17% |
| Saturn | ~7 arcsec/century | ~1% |
| Mars, Uranus, Neptune | ~3 arcsec/century | < 1% |
| Total (Newtonian) | ~532 arcsec/century | 100% |
These contributions are calculated by N-body integration of Newton’s inverse-square law over time — typically using JPL’s DE-series planetary ephemeris, not a closed-form equation. Le Verrier (1859, ~527″/century) first flagged the discrepancy with observation; Newcomb (1882, ~532″/century) refined it to the canonical figure underlying the ~43″/century GR anomaly. Newton himself never computed this — Mercury’s precession was not measured precisely until well after his death (1727).
The standard explanation
The standard explanation for the 43 arcsecond discrepancy is Einstein’s General Relativity (1915): space-time is curved near massive objects; Mercury, closest to the Sun, experiences the strongest curvature, producing an additional precession of ~43 arcseconds/century given by Δϖ_GR = 6πGM / (ac²(1−e²)) per orbit. This was one of the first major confirmations of Einstein’s theory.
The Settled Position — and a Coincidence Worth the Record
Resolved: the anomaly is General Relativity’s, in the model too. The model’s stated total for Mercury is the ecliptic rate plus the relativistic advance derived from its own constants — 529.03 + 42.98 = 572.0″/century, zero fitted values, additive and stated, never folded into a divisor. The supplement is gated: with the 1PN term switched on, the model’s own N-body engine reproduces Mercury’s observed 1800–2100 window rate exactly (the −43″/cy deficit closes to −0.0), and a standing assertion pins the measured closure to the derived formula within 0.1″/cy. An earlier reference-frame interpretation of the anomaly was proposed on this page, tested, and closed — the tests are kept below as the record.
The projection
In the model Mercury’s perihelion advances in ecliptic longitude at the chain’s Newtonian window rate, 529.03″/century — the planetary-perturbation value, its own integration with the relativistic term switched off. An observer on Earth does not measure that longitude directly: the sky is measured in right ascension, against the equator, which is tilted to the ecliptic by the obliquity ε. A direction advancing uniformly in ecliptic longitude λ advances in right ascension α at the rate
dα/dλ = cos ε / (cos²λ + sin²λ cos²ε)which is larger than 1 where the perihelion happens to sit. At Mercury’s J2000 perihelion longitude (77.455°) and the IAU 2006 obliquity the slope is 1.08036, so the 529.03″ ecliptic advance reads 571.54″/century in right ascension — an excess of 42.51″/century over the ecliptic rate. The general-relativistic advance, derived from the same constants the model uses (GM☉, c, Mercury’s semi-major axis and eccentricity: 6π GM/(c²a(1−e²)) per orbit), is 42.98″/century.
Nothing here is fitted. Three inputs — the chain’s Newtonian sidereal rate, its J2000 perihelion longitude, the IAU 2006 obliquity — and one coordinate identity. The agreement is 1.1 %, not exact: ranging determinations pin the inertial excess at 42.980 ± 0.002″/century (Pireaux & Rozelot 2003; Pitjeva’s EPM2008 residual to the relativistic rate is −0.004 ± 0.005″/century), so the projected 42.51″ falls 0.47″/century short of the measured value — many times its uncertainty.
What the model actually measures
The Earth-frame rate of Mercury’s perihelion motion is ~576.19″/century at J2000, flat over the last thousand years and oscillating around the ecliptic value over a full perihelion cycle. It is the ecliptic advance projected into the simulation’s equatorial frame — one identity, no fitted terms:
| term | ″/century |
|---|---|
| ecliptic advance (the chain’s window rate) | 529.03 |
| × projection slope dα/dλ | → 571.54 (+42.51) |
| + obliquity-rate term ∂α/∂ε · ε̇ (ε̇ = -46.8″/cy) | +4.31 |
| = Earth-frame rate | 576.19 |
So the “+48″” the simulation shows above the ecliptic rate is two coordinate effects: the projection of the advance (+42.51) and the slow decrease of the obliquity (+4.31). The first is the number that coincides with the relativistic anomaly.
The same projection for every planet
The statement is not made for Mercury alone. The identical projection, with each planet’s own ecliptic rate and J2000 perihelion longitude:
| Planet | Ecliptic advance (″/cy) | dα/dλ | Projection excess (″/cy) | GR advance (″/cy) |
|---|---|---|---|---|
| Mercury | 529.03 | 1.08036 | 42.51 | 42.98 |
| Venus | 14.09 | 1.00574 | 0.08 | 8.62 |
| Mars | 1,596.46 | 0.94195 | -92.68 | 1.35 |
| Jupiter | 488.47 | 0.92805 | -35.15 | 0.06 |
| Saturn | -1,576.66 | 1.08993 | -141.79 | 0.01 |
| Uranus | 806.60 | 0.92143 | -63.38 | 0.00 |
| Neptune | 9,101.68 | 0.97447 | -232.34 | 0.00 |
The projection reproduces the relativistic advance for Mercury and for no other planet: where the other planets’ GR advances are small, their projection excesses are large and of either sign. This table is published with the claim as its own test.
The verdict
The question is settled, against the projection. Three independent tests close it: (1) Precision — ranging pins the inertial excess at 42.980 ± 0.002″/century; the projection gives 42.51 — a 0.47″ shortfall, over two hundred times the measurement uncertainty. (2) The all-planet test — the identical projection fails for every other planet (table above), while ranging confirms the other planets’ relativistic advances directly (Venus 8.62, Earth 3.84, Mars 1.35″/cy). (3) No mechanism — the classical chains form the perihelion correction in ecliptic longitude, and the ranging chains form no equatorial angle anywhere, so there is no step on which the projection slope could act. Le Verrier’s Paris meridian series alone, re-solved as pure geocentric longitudes with no transit and no modern constant in the chain, yields the excess: δπ′ = 43.1 ± 16.5″/cy. Decisively, the model’s own N-body engine requires the relativistic term to match the observed window rate. What survives is the identity itself, kept as the record: a striking 1.1 % numerical coincidence at Mercury’s particular perihelion longitude — published together with the table that refutes it. The two effects were never the same kind of thing: the relativistic advance is a physical effect in the ecliptic, the same in every frame; the projection excess is a property of the measuring coordinate, drifting as λ and ε move (~+0.3″/cy per millennium) and swinging between −44″ and +48″ over Mercury’s full perihelion cycle.
The model’s Earth-frame RA rate (coordinate b) at 1800, 1900, 2000 and 2100 is 576.15, 576.17, 576.19 and 576.21″/century: essentially flat over the historical record. The model makes no prediction of a measurable decline of the anomaly within the era of precise measurement — its forward prediction is General Relativity’s.
BepiColombo: The Second Ranging Epoch
ESA’s BepiColombo mission arrives at Mercury on 21 November 2026 (delayed from December 2025 due to thruster issues), with orbital commissioning completing around March 2027 and routine science operations starting April 2027. The Mercury Orbiter Radio science Experiment (MORE) will measure Mercury’s orbit with 1–2 orders of magnitude better precision than MESSENGER. This provides the first opportunity to compare two high-precision measurement epochs — MESSENGER (~2013) and BepiColombo (~2027) — separated by ~14 years.
What the ranging missions measure
MESSENGER reported 575.31 ± 0.0015″/century in ICRF coordinates, and BepiColombo will report in the same frame. Both are ranging determinations: Earth–spacecraft distances fitted with a dynamical model that has General Relativity inside it (the PPN parameter β fitted jointly, β ≈ 1). The model’s prediction for BepiColombo is the same as General Relativity’s — ~575.31″/century again — because the model carries the relativistic advance as its derived supplement. What the mission adds for the model is the same thing it adds for GR: a second high-precision epoch bounding any secular change of the advance, and a much sharper solar-J₂ separation (below).
The model’s ecliptic rate for Mercury comes from its own N-body chain, measured over 1800–2100 with the relativistic term switched off,
Newtonian sidereal window = ~529.0″/centuryand that is the Newtonian ecliptic advance; it is 42.98″ short of the ranging value, which contains the relativistic term. Three caveats on the ranging value remain:
- Epoch. 575.31″/century is a determination at the MESSENGER epoch; BepiColombo gives a second epoch ~14 years later, which bounds any drift at the level of the missions’ uncertainties.
- The classical chain agrees. The historical 43″ (Le Verrier, Newcomb) came mainly from transits of Mercury — timing events in heliocentric ecliptic geometry — with meridian observations reduced to ecliptic coordinates on positions, not rates. No equatorial angle is formed in any of these chains — one of the three findings that closed the projection reading (above).
- What the fit actually determines. The reported ”575.31″/cy” comes from fitting a GR-inclusive ephemeris to spacecraft ranging data (Park et al. 2017 fit the PPN parameter β jointly, finding β ≈ 1) — the advance is constrained through the joint fit rather than read off as an angle. The precision of that constraint (±0.0015″/cy, with the EPM residual to the relativistic rate at −0.004 ± 0.005″/cy) is exactly what made the projection candidate’s 0.47″ shortfall a decisive refutation.
What the second epoch adds
The model and General Relativity make the same prediction here — the model ships the relativistic supplement — so BepiColombo is a consistency check for both, and its real gain for this page’s subject is the solar-J₂ separation below. The record of the projection candidate and its closure is the verdict above.
Solar Oblateness Uncertainty
The standard Mercury GR test has a rarely-discussed systematic uncertainty: the Sun’s gravitational quadrupole moment (J₂), caused by its oblateness, is not constant — it varies with the solar magnetic activity cycle (~11 years), and published J₂ values have ranged from ~10⁻⁵ to ~10⁻⁷ depending on the method. The solar oblateness contribution has the same temporal signature as the relativistic precession, making them difficult to separate. A 2022 study (MDPI Remote Sensing 14:4139 ) found that an unaccounted-for periodic J₂ component exceeding 0.04% of J₂ could falsely confirm or contradict GR in BepiColombo’s measurements. BepiColombo will improve J₂ determination by 1–2 orders of magnitude, but the time-variable component remains a systematic uncertainty.
Perihelion Precession Across the Solar System
The model calculates perihelion precession for all planets. Each planet has a perihelion point (location of closest approach to the Sun) that slowly drifts:
| Planet | Period | Direction | Ecliptic rate (a) (″/cy) | Earth-frame RA at J2000 (b) (″/cy) | Earth-frame RA range (b) (″/cy) |
|---|---|---|---|---|---|
| Mercury | ~23,199 yr | Prograde | ~529.0 | ~576 | -47 to +50 |
| Venus | ~22,463 yr | Ecliptic-retrograde | ~14.1 | ~4 | -10 to +13 |
| Earth | ~111,635 yr | Prograde | ~1,160.9 | — | -282 to +315 † |
| Mars | ~19,002 yr | Prograde | ~1,596.5 | ~1,497 | -126 to +152 |
| Jupiter | ~23,760 yr | Prograde | ~488.5 | ~458 | -43 to +47 |
| Saturn | ~16,503 yr | Ecliptic-retrograde | ~-1,576.7 | ~-1,718 | -143 to +132 |
| Uranus | ~23,907 yr | Prograde | ~806.6 | ~740 | -70 to +74 |
| Neptune | ~25,464 yr | Prograde | ~9,101.7 | ~8,872 | -801 to +895 |
† Earth’s range is the deviation of its perihelion-of-date rate from its mean over one perihelion cycle centred on J2000, read from the model’s own orbital series. The other planets’ ranges are the extremes of the Earth-frame projection over one perihelion cycle centred on J2000.
The Ecliptic rate column is the planet’s ecliptic perihelion rate, 360° per its period. The Earth-frame RA at J2000 column is that motion projected onto Earth’s equator at J2000, and the range column gives the projection’s extremes over one perihelion cycle centred on J2000. Prograde means counter-clockwise from above the North Pole. Saturn’s perihelion precesses ecliptic-retrograde (clockwise in the ecliptic frame) — see Supporting Evidence §9.
The range scales with the ecliptic rate, not with eccentricity. Saturn, on the shortest perihelion period, swings furthest (-143 to +132″/cy); Neptune, on the longest, least. Venus’s range (-10 to +13″/cy) is narrower than Mercury’s because its perihelion period is longer — the projection reads only the perihelion longitude and Earth’s obliquity, so how well a near-circular orbit (eccentricity ~0.00678) defines its perihelion does not enter.
The ecliptic and Earth-frame columns differ because Earth’s equator is not the ecliptic — the same projection detailed above, applied to every planet. Distinct from the anomaly and fully alive: each planet’s apparent Earth-frame rate oscillates while its ecliptic advance stays at the ecliptic rate. The oscillation is one closed formula with no fitted constants, Earth’s obliquity of date the only Earth input, so it is a reference-frame effect calculable for every planet from its period and J2000 perihelion longitude alone, no observation of the planet required (Formulas §5). It is the layer any Earth-based reading of a planetary rate must pass through, and the reason the simulator’s equatorial-frame exports must not be read against published ecliptic rates.
In the Interactive 3D Simulation: open the Show / Hide folder, enable each planet’s perihelion object (e.g., “PERIHELION Mercury”), set “1 second equals” to “1000 years”, press Run.
Key Takeaways
| Question | Answer |
|---|---|
| What is perihelion precession? | The slow rotation of a planet’s closest approach point around the Sun |
| Mercury’s cycle | ~23,199 years (prograde) in the ecliptic frame |
| The “anomaly” | ~43 arcsec/century — observed (~575″) minus Newtonian (~532″) |
| The explanation | Einstein’s General Relativity (1915) — space-time curvature contributes ~43 arcsec/century, the model’s position too: stated total 529.03 + 42.98 = 572.0″/cy, the supplement derived from the model’s own constants and gated against its own N-body engine |
| The projection candidate | Proposed here, tested, closed: the equatorial projection reproduces the anomaly to 1.1 % at Mercury — but falls 0.47″/cy short of the 42.980 ± 0.002 ranging value (>200σ), fails for every other planet, and no determination chain forms an equatorial angle; kept as the record of a striking numerical coincidence |
| What decided it | Ranging precision + the all-planet test + the absence of any equatorial step in either chain + the model’s own N-body requiring the 1PN term to match the observed window rate |
| The literature: history, the classical geocentric total, the critiques | Scientific Background §3 |
Continue to Mathematical Foundation to see the formal framework behind the model.