Climate Summary — Gravitational Coupling, Not Insolation, Drives Earth’s Climate
Climate is forced by gravitational coupling among solar-system bodies. Solar insolation is one channel through which that coupling reaches Earth — but the rhythm itself, captured by the 8H lattice, is the more complete description. Four headline numbers:
- R² = 0.87 — the 8H integer-divisor lattice (L1) alone, on post-MPT LR04 ice-volume variance
- R² = 0.05 — classical Berger 1978 insolation features alone, on the same record (17× less)
- ΔR² = 0 — adding Berger insolation features (with Laskar 2010’s wide-range eccentricity) to L1+L2+L3
- Charney ECS = 3.63 K, 90 % CI [3.01, 4.31] K — frequency-resolved climate sensitivity from the same lattice; consistent with Hansen 2013 / Sherwood 2020 / PALAEOSENS / IPCC AR6
And one structural finding: 0 of 32 L1 integers fully agree with Berger on both planet name and mechanism. The two frameworks agree on which periods exist (integer divisors of 8H) and disagree on which planets drive each beat. The lattice and the Berger parameterization are not independent forcings — they are different projections of the same physics, and the lattice is strictly more expressive.
This page is the synthesis. For architecture and per-regime fits see Climate Formula; per-integer attribution detail in L1 Attribution; the ΔR² = 0 evidence in Insolation Null Test; peer-reviewed lit comparison in Related Work.
Deep-time scope. 8H = 2,682,536 yr is the J2000 anchor; the L1 lattice positions (integer divisors of 8H) are invariant at any epoch but the literal year counts rescale at geological time (at 380 Ma H was ~309,083 yr). For the forward projection window (post-MPT) the J2000 anchor applies essentially unchanged; for the deep-time CENOGRID / CenCO2PIP regimes the lattice integers are what stays constant. See Expanding Resonance.
The question
What drives Earth’s climate variability over thousands to millions of years? Deep-sea sediments, ice cores, and atmospheric CO₂ records show periodic structure at ~23.7 kyr, ~41 kyr, ~95 kyr, ~405 kyr and longer. Standard Milankovitch theory (Berger 1978, Laskar 2004) attributes this to solar insolation modulated by Earth’s obliquity ε(t), eccentricity e(t), and longitude of perihelion ϖ(t). These three are themselves defined as sums of beats among Laskar’s fundamental frequencies (g_j, s_j, k) — so they are derivatives of gravitational coupling among the planets — but in the classical paradigm the climate-relevant quantity is the insolation those orbital elements produce.
The finding: gravitational coupling, not insolation alone
Earth’s climate variability is determined by the gravitational rhythm of the entire solar system, not by the obliquity / eccentricity / climatic-precession parameterization on its own. The classical Berger insolation features are mathematically derivable from the same Laskar secular theory, but they are a 4-feature projection of a more complete rhythm. The 8H integer-divisor lattice describes that rhythm at finer granularity.
- R² = 0.87 — 32-integer 8H lattice (L1) alone explains 87% of post-MPT LR04 ice-volume variance.
- R² = 0.05 — Berger insolation features alone explain only 5% on the same record (~17× less). With Laskar 2010’s full-range eccentricity the number rises to 0.29 — still less than L1.
- ΔR² ≈ 0 — adding Berger features to a fitted L1+L2+L3 increases R² by < 0.005 in every regime tested, and by literally zero on LR04 under Laskar 2010 substitution.
Berger’s parameterization is not wrong; it is a special case. Its named peaks (23.7 / 41.2 / 95 / 405 kyr) correspond to specific positions on the 8H lattice, or — for 405 kyr — to the off-lattice silicate-weathering carbon-cycle resonance (L2).
The same lattice also yields a Charney equilibrium climate sensitivity estimate. Per-line amplitudes from the L1 fit feed a frequency-resolved decomposition of ice-albedo versus CO₂ / greenhouse-gas forcing at each orbital band; Monte Carlo marginalisation over the four calibration constants gives Charney ECS = 3.63 K, 90 % CI [3.01, 4.31] K. The result is consistent with Hansen 2013, Sherwood 2020, PALAEOSENS / Köhler 2017, and IPCC AR6 within their respective uncertainties — derived from an orthogonal direction: a fixed-lattice frequency-domain decomposition rather than the standard LGM-to-Holocene time-domain comparison. Method in Climate Formula §Ice-Albedo Decomposition; full per-source comparison values in Related Work.
How we tested this
The framework was evaluated on four independent paleoclimate records using deterministic, reproducible analysis scripts:
| Record | Span | Recording mechanism |
|---|---|---|
| LR04 benthic δ¹⁸O (Lisiecki & Raymo 2005) | 0–5.3 Myr | Deep-sea sediment ice-volume proxy |
| EPICA Dome C CO₂ (Bereiter 2015) | 0–800 kyr | Antarctic ice-core trapped atmosphere |
| CENOGRID (Westerhold 2020) | 0–67 Myr | Cenozoic benthic δ¹⁸O + δ¹³C |
| CenCO2PIP (Consortium 2023) | 0–66 Myr | Bayesian multi-proxy CO₂ synthesis |
The empirical null test follows directly: if the 8H lattice subsumes the Berger insolation parameterization, then adding Berger’s 4 insolation features (ε, e, e·sin ϖ, e·cos ϖ) on top of a fitted L1+L2+L3 should add essentially nothing to the R². Across every regime tested, the maximum ΔR² is +0.004 — well below the 0.005 pre-registered rejection threshold. Substituting Laskar 2010’s full-range eccentricity (which varies 0.003–0.06) hardens the result: ΔR² drops to 0.000 on LR04 and 0.00001 on EPICA CO₂. Per-regime breakdown and the L1-alone / Berger-alone / combined comparison table are in Insolation Null Test §3.
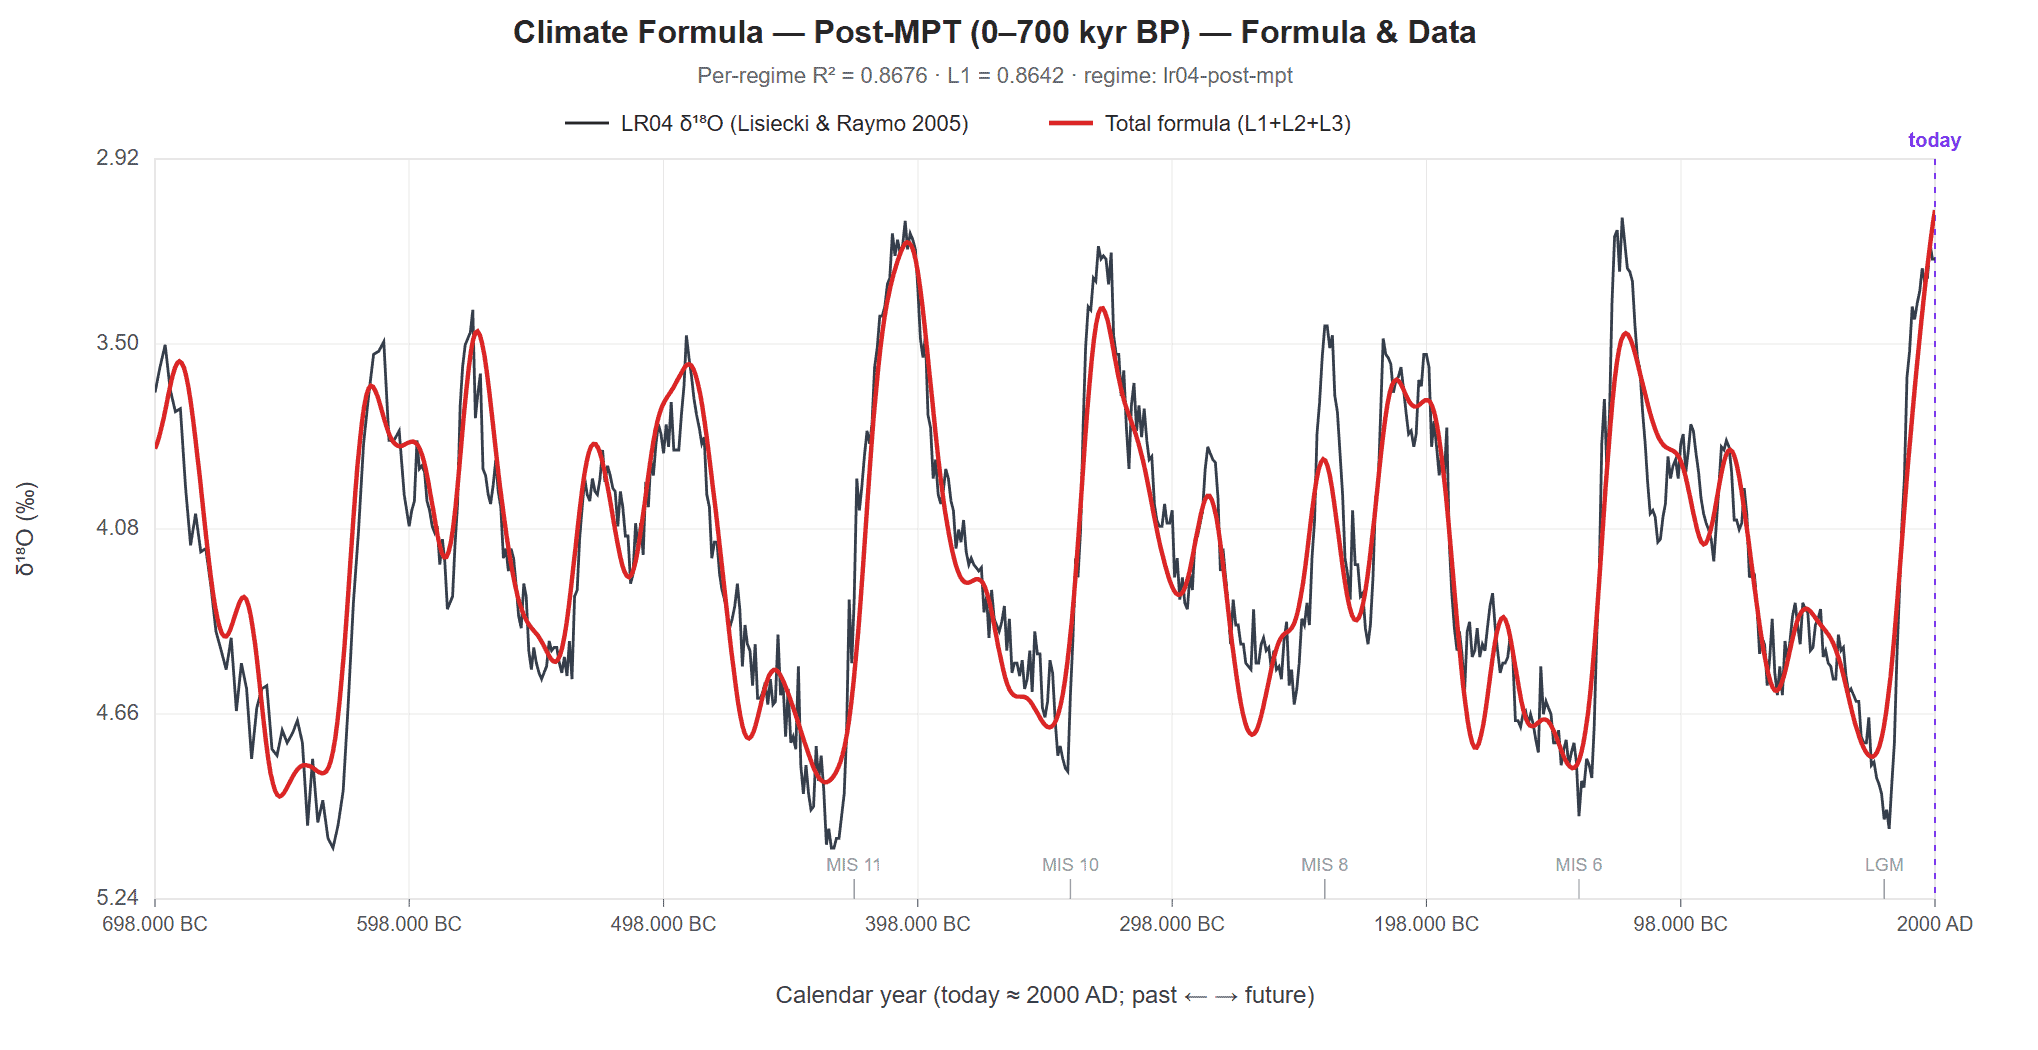
The canonical formula on LR04 δ¹⁸O over the past 700 kyr. R² = 0.87 — the 32-integer 8H lattice + 3-line carbon thermostat + 6-step transitions captures most of the post-MPT climate signal. Lattice positions are fixed by orbital geometry; only the amplitudes are fitted.
Reproducibility scripts in the 3d repository .
What we found
Every significant LR04 climate peak lands at an integer divisor of 8H. The 32-integer L1 set = 25 canonical Berger / Mars–Jupiter beats + 6 precession-band sidebands (k+g_j sub-peaks surfaced by an MTM F-test scan over all 200 integer divisors of 8H) + 1 Berger-quintet completion (n=141, k+g₃ ~19 kyr; subthreshold in LR04 but 3σ in the Cheng 2016 Asian-monsoon record). The full per-integer table with dual attribution is in L1 Attribution; the lattice itself in Climate Formula.
Sample correspondences between Berger’s classical insolation peaks and the L1 lattice:
| Berger insolation feature | Laskar beat | L1 integer |
|---|---|---|
| Eccentricity 95-kyr beat | g₄ − g₅ | n = 28 |
| Eccentricity 405-kyr line | g₂ − g₅ | off-lattice → L2 |
| Climatic precession 23.7 kyr | k + g₅ | n = 113 |
| Climatic precession 22.4 kyr | k + g₂ | n = 120 |
| Obliquity 41.2 kyr | k + s₃ | n = 65 |
The periods are computed from the Laskar 2004 eigenmode beats — for the obliquity row, k + s₃ = 50.29 − 18.85 = 31.44″/yr → period 1,296,000 / 31.44 = 41,222 yr ≈ 41.2 kyr. The textbook “41 kyr” rounding (Berger 1978) and the model’s 8H/65 = 41.27 kyr refer to the same Laskar eigenmode.
A stronger comparison: every L1 integer also has an Earth-planet PLANET_CYCLES attribution (a multi-planet beat involving Earth’s spin axis + 1–2 planet harmonics). Cross-tabulating both attributions: 0 of 32 L1 integers fully agree with Berger on both planet name AND mechanism — see L1 Attribution.
The 32-integer lattice plus two non-orbital layers form the canonical climate formula, fit by sequential ridge regression independently per climate regime. Per-regime R² reaches 0.87 (post-MPT LR04), 0.85 (EPICA CO₂), 0.76 (CenCO2PIP 0–66 Ma). Architecture and detailed fit tables in Climate Formula.
What the formula tells us about the present and near-future
Forward projection. The canonical formula, fit on the post-MPT regime (0–1 Ma) and extrapolated forward 250 kyr, identifies the next natural glaciation peak at ~60,500 AD (~58,500 yr from now), the warmest interglacial at ~166,000 AD, and the strongest glaciation in the window at ~198,500 AD. Forward projection stays in scope only within the post-MPT regime; anthropogenic CO₂ is not modelled. Past glacial maxima (LGM, MIS 6, MIS 8) are correctly identified within ≤9 kyr (the expected ice-sheet response lag). Detail in Climate Formula §Forward Projection.
Current cycle position. The L2 405-kyr carbon-thermostat layer in the formula sits near a warming peak around the present era — a fitted observation from LR04 (the L2 layer’s phase is set by the regression; the cycle position falls where it falls):
| Quantity | Value |
|---|---|
| L2 fundamental period | 405 kyr (g₂ − g₅, Venus–Jupiter eccentricity beat) |
| L2 amplitude (post-MPT fit) | ~0.5–1.0 °C peak-to-trough |
| Current phase | Near warm peak |
| L2 rate of change at peak | < 0.005 °C / century |
Two natural-cycle signals point opposite directions for the current era:
- Precession-driven NH summer insolation (~23.7 kyr) is in a declining phase since the Holocene Climate Optimum (~10 kyr BP) → standard view: natural trend is cooling.
- 405-kyr eccentricity carbon thermostat (L2) is near peak → framework: natural baseline slightly warmer than long-term mean.
Both signals are real; they sit at different timescales. Mainstream Holocene-attribution discussions emphasise the first; the second is rarely cited outside cyclostratigraphy. This is connected to the active “Holocene Temperature Conundrum” debate (Nature 2022).
Limitations
Regime change. Cross-regime predictive power is zero. The formula is fit independently per regime because per-line amplitudes evolve with boundary conditions (CO₂, ice-sheet area, hysteresis). The forward projection stays in scope only while the post-MPT regime persists; an unscheduled boundary-condition shift would invalidate the projection beyond it.
Anthropogenic CO₂ is not modelled. The formula captures orbital forcing (L1) + silicate-weathering carbon-cycle thermostat (L2) + discrete Heaviside step transitions (L3). It does NOT model ice-sheet hysteresis dynamics, CO₂ amplification feedbacks beyond L2, regional asymmetries, internal variability, or anthropogenic CO₂. The ~60,500 AD glaciation onset is when the orbital clock makes a phase transition possible; the actual ice-volume response can lag by thousands of years. Ganopolski et al. 2016 found moderate-emission anthropogenic CO₂ may delay the next natural glaciation by 50+ kyr (high-emission ≥100 kyr).
Bounded conclusions only. The framework’s claim is about the gravitational-coupling rhythm and its parameterization, not about the rate or magnitude of anthropogenic warming. L2’s slow rate of change (< 0.005 °C / century at peak) is ~300× too slow to explain industrial-era warming (~0.7 °C / century). The current-era L2-peak observation affects baseline level, not recent rate. The framework is descriptive within regimes, not predictive across boundary-condition shifts.
See also
- Climate Formula — architecture, per-regime fits, forward projection
- L1 Attribution — per-integer Berger vs Holistic top-1 attribution
- Insolation Null Test — empirical basis for the ΔR² = 0 claim
- Related Work — position relative to 2024 climate-forcing literature
- Fundamental Cycles — what each L1 integer is
- Fibonacci Laws — the structural identities the integer divisors encode
- Expanding Resonance — how the 8H lattice (and its integer divisors) evolve across geological time