Timekeeping & Delta-T
Earth’s rotation is not constant: it speeds up and slows down in cycles, so the length of day (LOD) varies, and atomic time and observed time drift apart by the quantity called Delta-T (ΔT). This page is about the millennial-scale LOD cycle — a few milliseconds of swing around the slow tidal slowing, which the model writes closed-form as four fitted millennial cycles and tests against two and a half thousand years of eclipse records. The slow background itself, LOD across geological time, is the subject of Expanding Resonance; the cycle here rides on top of it. The day lengths the cycle modulates are defined on Days & Years.
This page establishes:
- What TT, UT and ΔT are, and why ΔT has its V-shape — Two timekeeping systems, What is Delta-T?, The Delta-T V-shape.
- The model reproduces the 1650–2050 ΔT record without polynomial coefficients fitted to it — Model vs observation.
- The cycle is four harmonic lines on periods fixed before the amplitude solve, plus one aperiodic Core-mantle episode; the periods are close to named climate and solar cycles, and that identification is not established — The millennial cycle.
- Three eclipse-record tests close ΔT and reject the Munk–MacDonald non-tidal postulate; the Bond IRD correlation is an open correspondence, not a validation — Empirical validation.
- The deep-time background, the deglacial sign flips, and the leading indicator they imply — When the day got shorter, Deep-time LOD.
Two timekeeping systems
| System | Definition | Behaviour |
|---|---|---|
| Terrestrial Time (TT) | Fixed at exactly 86,400 SI seconds per day | Constant, based on atomic clocks |
| Universal Time (UT) | Based on Earth’s actual observed rotation | Varies with rotation speed |
TT is a uniform timescale calibrated to the mean solar day around 1820 AD — independent of Earth’s actual rotation, used for astronomical predictions. UT represents Earth’s observed rotation angle relative to an inertial reference frame — time as actually experienced on Earth.
What is Delta-T?
Delta-T (ΔT) is the difference between the two systems:
ΔT = TT − UT- When Earth rotates slower (LOD > 86,400 s): UT falls behind TT, ΔT increases.
- When Earth rotates faster (LOD < 86,400 s): UT gains on TT, ΔT decreases.
| Era | ΔT |
|---|---|
| ~1900 AD | ~0 s |
| 2020 AD | ~69 s |
The IERS maintains the official ΔT values. Leap seconds are occasionally added to UTC to keep it within 0.9 s of UT1; per the 2022 CGPM resolution, leap seconds are scheduled to be phased out (or have their tolerance significantly relaxed) by 2035. All estimated ΔT values before 1955 AD depend on observations of the Moon, either via eclipses or occultations; values from 1955 AD onward are directly measured.
Two ΔT values at J2000 — same physics, different measurements. The IERS-observed instantaneous ΔT at J2000 is ~63.63 s: the raw measurement of TT − UT at that year, including decadal-scale non-tidal residuals (ENSO, atmospheric angular-momentum transfer, mantle-core coupling) that vary on year-to-year timescales. The framework’s ΔT trend anchor deltaTStart = 56.08 s is the smooth long-term signal passing through J2000 — the noiseless mid-line of the calibrated model. Readers cross-checking the calculator’s ΔT trend row against published IERS values should expect this ~8-second offset. The two are not competing; they measure different things.
The Delta-T V-shape
The historical Delta-T curve from 1650 AD has a distinctive V-shape:
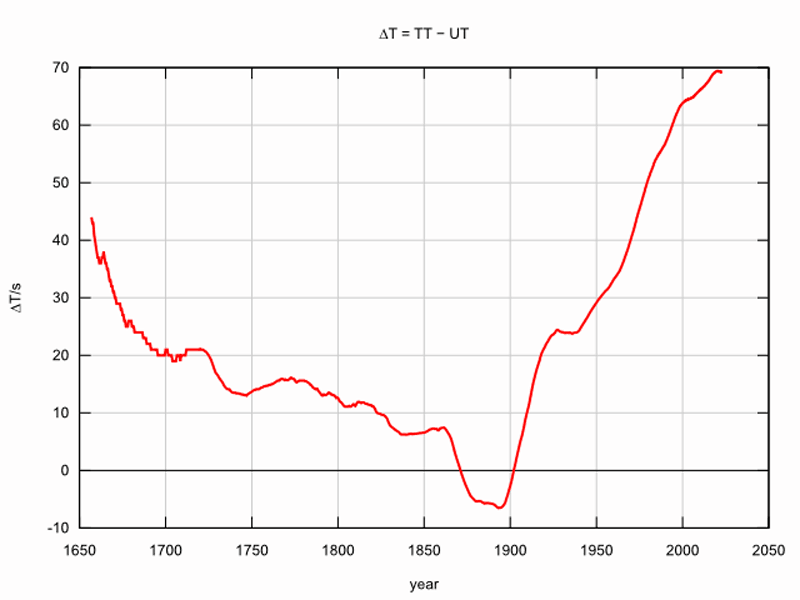
- ~1820 AD: SI second was calibrated to the mean solar day → ΔT = 0 by definition.
- ~1820–1900 AD: ΔT decreased slightly into negative values as LOD stayed near (and briefly below) 86,400 s.
- ~1900 AD: ΔT reached its actual minimum (~−3 s) when LOD finally exceeded 86,400 s and the trend reversed.
- After ~1900 AD: LOD has stayed above 86,400 s, so TT pulls ahead of UT (ΔT increasing).
The underlying trend is that LOD has been slowly increasing over centuries, crossing the 86,400-second mark around 1900 AD.
Model vs observation — the 1650–2050 fit
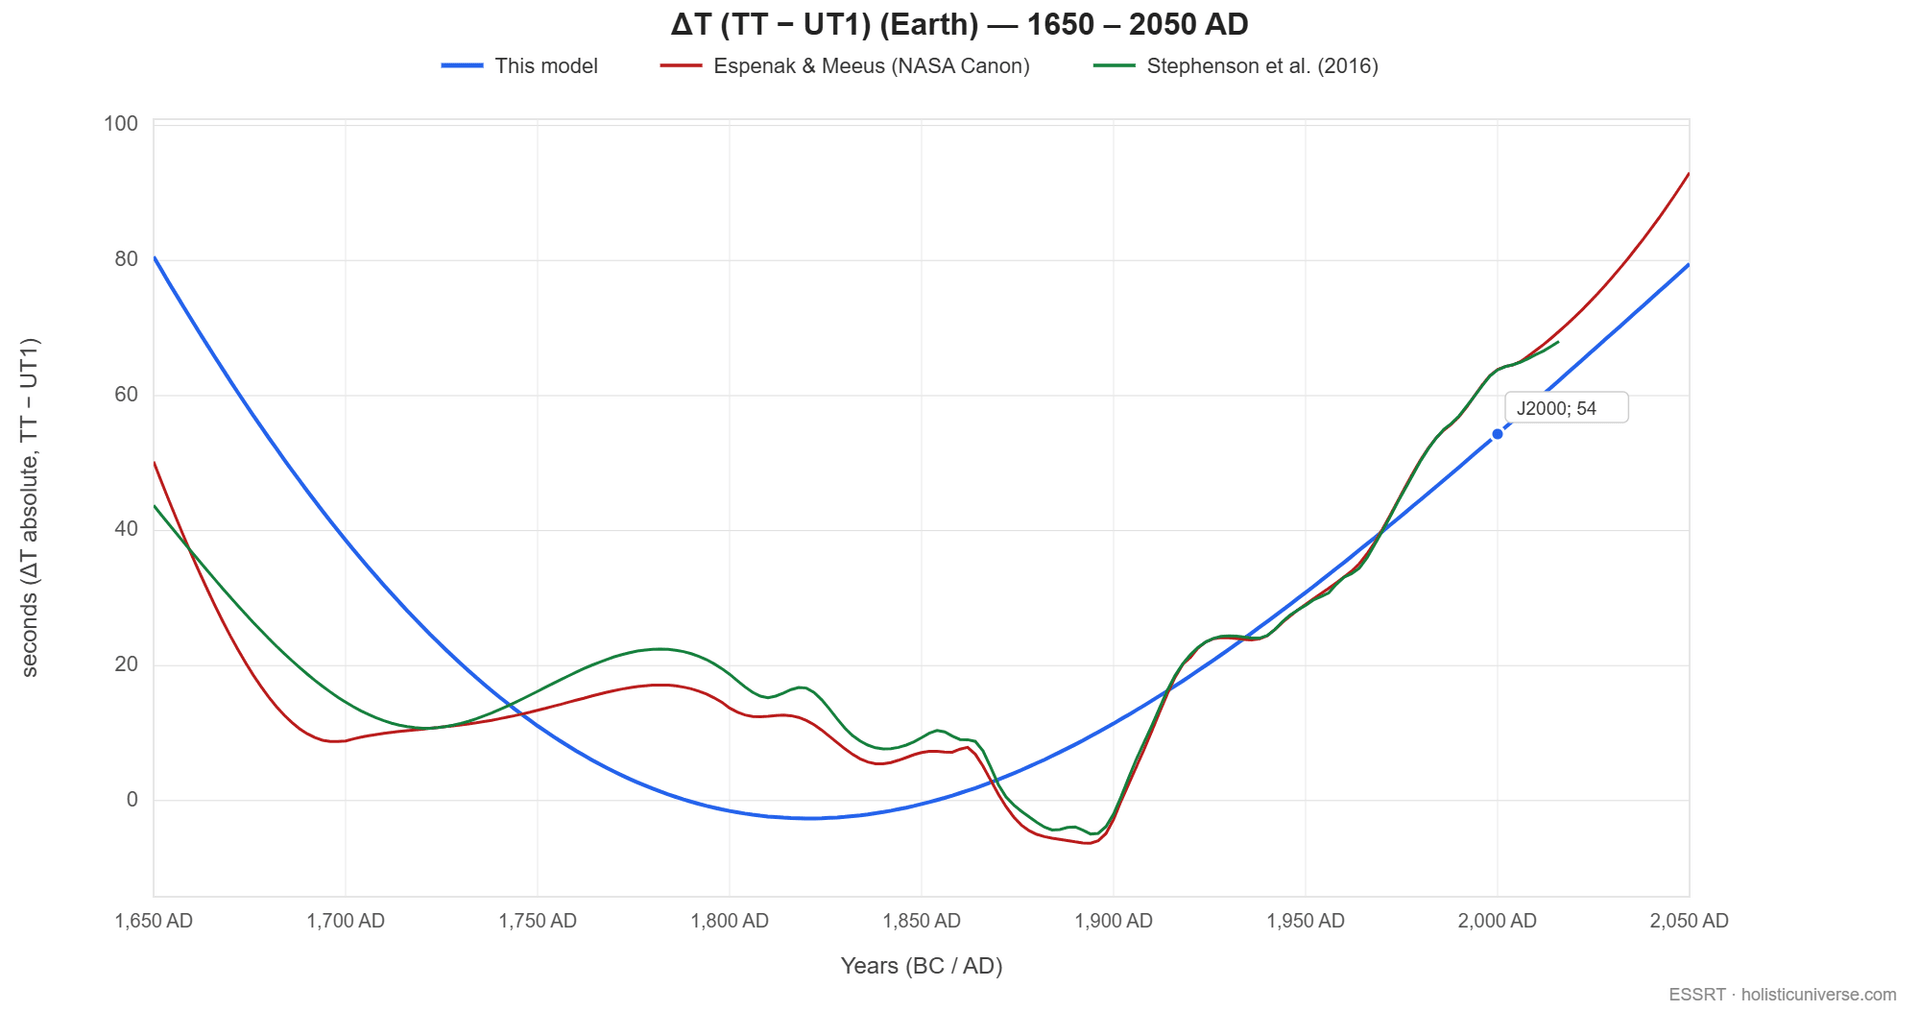
The framework’s ΔT trend curve reproduces the historical V-shape across 1650–2050 without polynomial coefficients fitted to observed ΔT. It is anchored at deltaTStart = 56.08 s at J2000, and derived from the LOD chain plus the four cyclical harmonics and the Core-mantle swing episode described below. The residual against Espenak’s polynomial across 20 reference years 1650–2017 is ≈12.5 s RMS. The V-shape is not fitted; it emerges from the pure-tidal LOD trend plus the four harmonic cycles. The exact location of the minimum near ~1900 AD is a prediction rather than a curve-fit.
The model’s interpretation: a millennial cycle
In the model, LOD itself only grows — the secular tidal + GIA baseline (+1.77 ms/cy at J2000) is modulated by the four fitted millennial cycles plus the Core-mantle swing (detailed below), never overcome. What varies cyclically is the growth rate: the composite stack superimposes a few-millisecond δLOD swing around the secular trend line:
- The stack is currently in a descending phase — LOD growth runs below the secular baseline (observable total +0.07 ms/cy at J2000; channel breakdown under Empirical validation below and Days & Years)
- The modulation bottoms out (stack trough, LOD furthest below the trend line) near ~2,205 AD and crests (stack peak) near ~2,742 AD; successive extrema follow the Bond/Hallstatt/Jose beat structure
- Short-term fluctuations are superimposed on this millennial modulation, which itself rides on the secular tidal trend
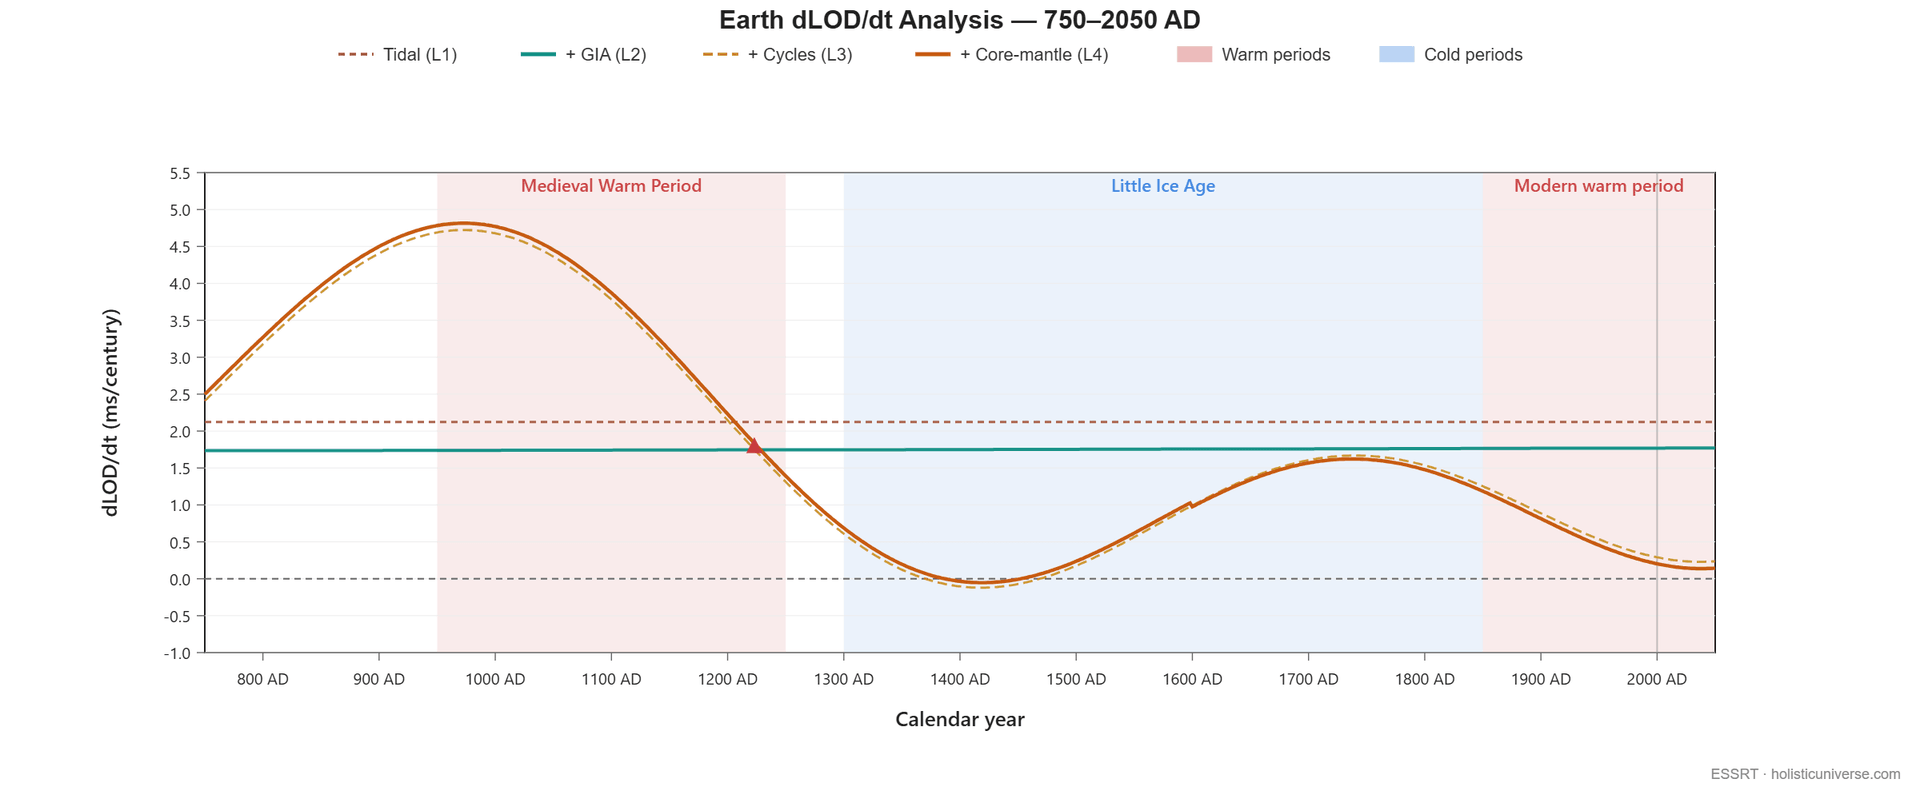
This millennial cycle is itself superimposed on the slow secular LOD evolution, captured by the proper-physics two-layer formula (Expanding Resonance). Earth-Moon tidal coupling makes the very-long-term LOD trend monotonically upward, lengthening the precession clock by ~0.025 % per Myr at the current rate. On millennial timescales, though, the LOD runs alternately a few milliseconds above and below that secular trend line. The growth rate oscillates; the growth itself never reverses.
The two effects act on very different timescales and add. The long secular tidal background is what Wells 1963 measured as ~400 days/year in the Devonian. The millennial cycle described here is what is measured in century-scale Delta-T records.
The model does NOT claim tidal friction doesn’t exist. Established physics is well-documented on four counts. Lunar laser ranging measures the Moon receding at 3.82 cm/yr, the angular momentum transferred from Earth. Earth’s rotation slows at ~+1.7 to +2.3 ms/century, from the combined tidal-friction signal and post-glacial rebound. Eclipse records over 2,700 years confirm the long-term slowing (Stephenson, Morrison & Hohenkerk 2016 ). And since ~2000, ice melt in Greenland and Antarctica has added ~+1.33 ms/century, projected to reach ~+2.62 ms/century by 2100 (Adhikari & Ivins 2016 ).
The model’s claim is that a millennial-scale variation is superimposed on the tidal slowing. Standard theory holds that tidal slowing dominates monotonically over all timescales. This is the testable difference: can a millennial cycle exist alongside (and partially counteract) tidal slowing? The model predicts yes — continued precision measurement over centuries can distinguish the two pictures. The model predicts the long-term trend of LOD, not short-term fluctuations from ENSO, volcanic events, or core dynamics; the 2020–present data is consistent with the trend but does not prove it.
Two pieces of independent evidence are consistent with cyclically modulated LOD growth and are treated canonically at Supporting Evidence:
- The 2020–present rotation speedup: Earth has been rotating faster against the long-term tidal slowing. 2020 produced 28 shortest days since atomic clocks were invented; July 5, 2024 set the all-time record at 1.66 ms under 24 hours; 2025 saw three notably short days (July 9, July 22, August 5) without breaking the 2024 record. The IERS acknowledges difficulty predicting LOD beyond ~6–12 months. Qualitatively consistent with the model’s cyclical prediction; not yet evidence of the long-term trend reversal itself. See Supporting Evidence §2.
- The 1-billion-year day-length stall: Mitchell & Kirscher (2023, Nature Geoscience 16, 567) showed Earth’s day length stalled at ~19 hours for roughly 1 billion years in the mid-Proterozoic (2.0–1.0 Ga) — atmospheric thermal tides balanced lunar tidal drag. Complex, non-monotonic LOD dynamics are not unprecedented. See Supporting Evidence §3.
Where the millennial cycle comes from — the four harmonic cycles
The millennial cycle is not one signal but four: four fitted millennial periods, each a bounded harmonic term stated in years.
Each of the four is numerically close to a cycle named in the paleoclimate or solar-activity literature — a correspondence in period, which the testing below does not extend to phase:
| Cycle | Period | Physical anchor |
|---|---|---|
| Bond | 1,466 yr | 74 × Jupiter–Saturn synodic; numerically close to the Bond et al. 2001 ~1470-yr North-Atlantic ice-rafted debris cycle, though phase testing does not establish the two as the same signal |
| Hallstatt | 2,430 yr | Solar-activity Hallstatt cycle (~2400 yr in cosmogenic-isotope reconstructions) |
| Jose5 | 897 yr | 5 × Charvátová Jose 179-yr solar-inertial-motion cycle |
| Jose4 | 716 yr | 4 × Charvátová Jose 179-yr cycle |
The four periods were chosen by the fitter’s scan and are held fixed in the amplitude solve, with no free period parameters. They are not structural predictions; the ~1.5-kyr oscillation itself is the real signal.
The four amplitudes and phases are calibrated in one joint solve, together with the Core-mantle swing episode below, against the observed ΔT history. The fit target for them is the Stephenson 2016 residual. The ΔT trend anchor is then swept against the Espenak polynomial 1650–2017, so an Espenak-scored residual is in-sample, not a held-out score. Throughout, the LOD at J2000 is pinned to the USNO Earth Orientation Center anchor of 86,400.0012 s as a hard equality constraint.
The combined net contribution of cycles + swing to LOD at J2000 is ≈ -2.24 ms, part of the Layer 4 composite in Days & Years.
What makes this more than a curve-fit is not where the periods came from, because they were scanned for. It is that they are fixed before the amplitude solve and carry no free parameters in it, and that the four-harmonic set is the optimal one. Removing any harmonic degrades both the in-sample closure — Espenak RMS rises from 12.5 s to 26–35 s — and out-of-sample prediction of an era withheld from the fit. Predicting −720 to 0 CE from post-CE data alone, the full set scores 85 s RMS against 94–307 s for any reduced set and a 223 s no-correction baseline.
Two limits belong with that result. First, no individual harmonic is significant on its own — each sits below its own permutation threshold in the ΔT record, so the four carry the residual collectively rather than severally. Second, the identification of these periods with the named cycles they are numerically close to is not established. Band-limited phase testing puts the Bond harmonic close to anti-phase (175°) with the Bond 2001 IRD record it is named for, and cross-archive coherence, where it clears a permutation threshold at all, sits at the noise margin (R² ~0.01 in EPICA CO₂). Bond in fact has the weakest deep-time archive support of the four, failing Steinhilber outright; its strength is in the ΔT record. Full audit: doc 105 .
These are ΔT correction terms on periods fixed before the amplitude solve — which is what they were calibrated against and what they demonstrably close — not detections of the named cycles.
The fifth component — the Core-mantle swing. On top of the four periodic cycles, the joint solve fits one aperiodic episode: a damped oscillation of the core’s eigenmode. It was excited around 1600 BC, actively terminated around 1600 AD, and driven at the bond−hallstatt difference tone (≈ 3,695 yr). The eigenmode has T₀ ≈ 3,916 yr and Q = 1.8, inside the published axiMC eigenmode range.
Physically this is the documented millennial core–mantle LOD fluctuation: angular momentum exchanged between core and mantle, not climate mass-redistribution. It is Stephenson–Morrison–Hohenkerk’s ~1,500-yr oscillation, with the mechanism per Dumberry & Bloxham 2006. It contributes +0.01 ms/cy at J2000 and is the model’s fourth dLOD/dt driver — see doc 104 for the full derivation.
Empirical validation against the historical eclipse record
The closed-form ΔT formula on this page has been tested directly against the documented historical record on three complementary tracks — two eclipse-based and one climate-proxy-based.
- Solar-eclipse alignment audit — 26 documented solar eclipses spanning -762 BCE (Bur-Sagale, Nineveh) to 2026 CE (Burgos total). Using the model’s own predicted UT and umbra track (no external ΔT polynomial in the loop), the audit scans ±4 hours around each documented preset UT and asks whether the model umbra reaches the observation site.
| Verdict category | Count |
|---|---|
| Umbra reaches observation site within ±4h scan | 21/26 |
| — of which ΔT-signal + regional (framework UT differs from documented UT) | 0/26 |
| Pure geographic miss (>1,000 km at every scanned moment) | 5/26 |
-
Lunar timing test (L-5b) — 267 primary-source lunar observations from Stephenson 2016 (Babylonian, Greek, Chinese, Arab traditions; -720 BCE to 1280 CE). Framework mean |residual| is 20.2 min (1,214 s mean |residual|), beating NASA’s Espenak/Meeus polynomial on 117/267 events — a ground-truth test independent of NASA’s ΔT polynomial. Four independent observation traditions agree on the framework’s residual magnitude after detrending.
-
Solar cross-validation (L-7) — 89 primary-source solar observations (Stephenson 2016 S03/S06/S08). Framework matches NASA to within one second (664 vs 672 s RMS), beating NASA on 39/89 events. Same physics as L-5b, independent dataset.
The three tests together resolve the long-standing ambiguity about the non-tidal Earth-rotation component. The Munk-MacDonald-scale (~5-6 ms/century) non-tidal-speedup postulate is rejected by the historical eclipse record (the framework fits without it). A GIA-scale channel (dLOD/dt = -0.35 ms/century at J2000) is included as the α(t) correction, with zero parameters fitted to eclipse data. It is anchored on Cox & Chao 2002 satellite gravimetry, with the deep-time trajectory tied to the L1 orbital layer of the Climate Formula.
Combined with the tidal channel (+2.12 ms/century, Farhat 2022 / LLR α₁ = 3.82 cm/yr), the framework’s secular Tidal + GIA rate at J2000 is +1.77 ms/century. That matches IERS observed +1.75 ms/century within 1%, using only two literature-anchored parameters and no fit to the observed rate. Adding the 4-cycle stack derivative (-1.71 ms/century at J2000, currently on the descending part of the Bond cycle) and the Core-mantle swing (+0.01 ms/century) gives the full observable rate +0.07 ms/century.
Full methodology and detailed results:
- Solar Eclipse Validation — 26-event eclipse alignment audit, methodological corrections, Moon polynomial NASA cross-check, ancient-record adjudication.
- Lunar Eclipse Validation — α(t) GIA physics derivation, three-way comparison, per-table cross-cultural consistency, three-component decomposition of the medieval residual, and eight-hypothesis testing with per-era drift-tracking downgrade.
The Bond 2001 IRD comparison
This is an open correspondence, not a validation. The correlation below is real as a number, but it fails every null test available to us, and it is not carried by the 1466-yr Bond period. It is not evidence that the stack’s periods are the climate periods. The statistics are at the end of this section.
Call the stack’s cumulative δLOD contribution — cycles plus Core-mantle swing — Σ_stack. It correlates with the North Atlantic drift-ice record of Bond et al. 2001 at Pearson r = +0.41, on the validated window 4,000 BC to 1,800 AD. That is the same hematite-stained-grain stack Bond used to identify his 0-8 cold events.
The stack was fit against the Stephenson 2016 ΔT residual — an eclipse-timing dataset, not a climate record — and never against Bond’s data, so the comparison is out-of-sample. But out-of-sample is not the same as significant, and this one is not (see below). The pre-joint 4-flag stack alone gave r = +0.49; folding in the Core-mantle swing dilutes the climate correlation, exactly as the two-engine decomposition predicts, because that swing is core-supplied angular momentum rather than climate.
Framework-vs-IRD (+0.41) is stronger than framework-vs-GISP2 Greenland temperature (+0.24 in the same window) because Bond 2001 IRD is the same physical drift-ice-driven mass-redistribution signal the Bond harmonic is modelling; GISP2 is a local Greenland temperature signal with additional confounders.
Two mechanisms, opposite signs — read this before interpreting any rotation-climate statement. Climate reaches Earth’s rotation through two physically distinct mechanisms that respond to the same climate signal in opposite directions. This is standard geophysics and holds independently of this framework:
- Surface mass — warming melts ice, the meltwater spreads through the global ocean, mass moves equatorward, Earth’s moment of inertia rises and the day lengthens. Effectively concurrent with the climate signal. The 4-flag stack is hypothesised to carry this mechanism, and the Σ_stack sign convention below is that hypothesis written down — not an established property of the flags. The tests immediately below are what it fails.
- Solid Earth (GIA) — once the ice load is gone the mantle rebounds poleward, the moment of inertia falls and the day shortens. Lagged by the mantle relaxation time (~4–6 kyr). The α(t) channel implements this mechanism by construction, anchored on Cox & Chao satellite gravimetry, so here the identification is secure.
Both mechanisms are real, and the observable rotation is their sum — so the two can disagree about what today’s rotation “means”. At J2000 the GIA term is -0.35 ms/cy (interglacial rebound continuing) while the stack term is -1.71 ms/cy and descending toward its trough at ~2206 AD. The opposition is also why the deglacial spin-up leads peak warmth rather than coinciding with it (Prediction 6). Applying one channel’s sign rule to the other’s number is the easiest mistake to make here.
The stack channel’s sign convention reads: Σ_stack > 0 means LOD above baseline, surface mass equatorward, a warm anomaly; Σ < 0 means cold. Under it the framework matches on 4 of 5 named events inside the validated window — Bond 4 (-3950 BC, cold ✓), the 4.2 ka event (-2250 BC, cold ✓), the Roman Warm Period peak (+100 AD, warm ✓) and the MWP peak (+1050 AD, warm ✓). The Maunder Minimum (+1670 AD, cold) misses narrowly, at Σ = +0.45 ms.
Events outside the window are expected to miss. Three pre-window events — the Younger Dryas, the 8.2 ka event and the Holocene Optimum peak — drift with fit-window extrapolation. The post-window Dalton Minimum (+1810 AD) and Modern warm (2000 AD) fall in the modern era, where anthropogenic warming dominates; the framework, a pure orbital/tidal model, correctly does not predict it.
Those event scores are the most favourable slice of the relationship, and should not be read alone. Each samples a single hand-picked year. Scored across the full named-period bands instead — every year in each period — the sign rule holds for 65 % of years against a 50 % coin-flip baseline, and for 0 % of the Little Ice Age, where Σ_stack stays positive (“warm”) across all five centuries. The event test books the LIA as one narrow miss at Maunder; it is in fact a five-century systematic one.
Three further null tests:
| Test | Result | Null |
|---|---|---|
| Crossing timing vs 10 named transitions | median 262 yr, p ≈ 0.19 | Monte-Carlo median 353 yr |
| Band-limited phase, 4 harmonics × 2 proxies × 2 windows | no band survives correction for the 16 tests; Bond band ≈ anti-phase (175°) vs IRD | phase-randomised surrogates |
| Windowed phase-tracking, drifting phase permitted | no band significant; Bond↔IRD PLV p = 0.49 | phase-randomised surrogates |
So the correlation is real — about 17 % of variance — but it does not live at the 1466-yr period the framework attributes it to. The four cycles stand on their ΔT closure, which is what they were fitted to and what they demonstrably achieve; the step from there to “these are the climate cycles” is not currently supported.
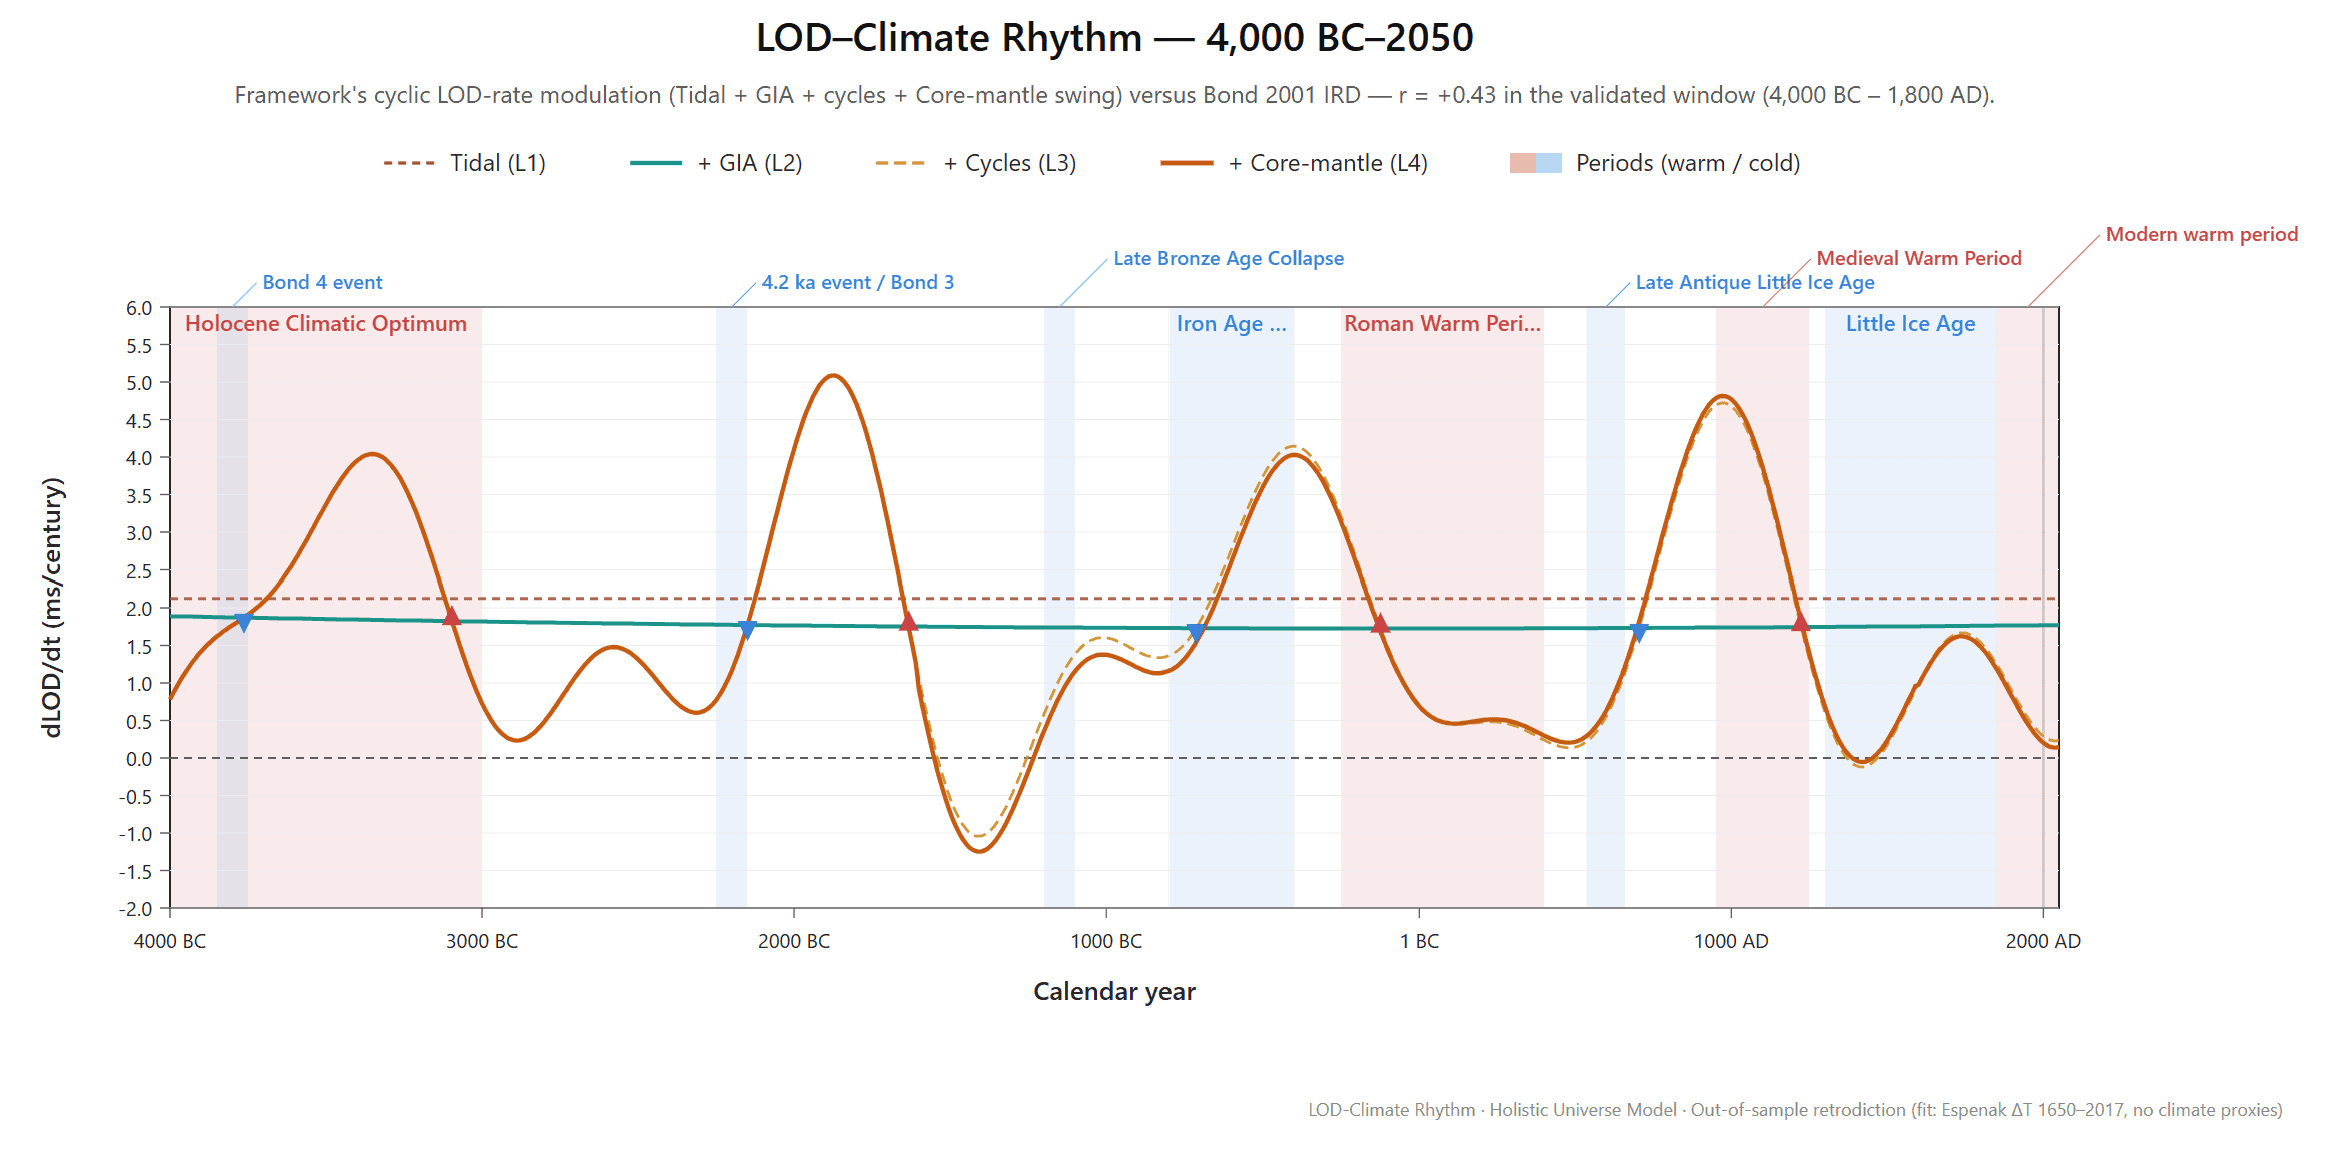
The interactive Earth dLOD/dt Analysis modal in the simulator’s Tools folder exposes this comparison. Toggle the layers — Tidal (L1), + GIA (L2), + Cycles (L3), + Core-mantle (L4), plus the isolated Bond and Core curves. Then pick a time window from 27,500 BC to 15,000 AD, overlay the GISP2 or LR04 temperature curve, and read the correlation numbers off the panels underneath.
What the stack does establish. It closes ΔT against Stephenson’s eclipse residual — that is its empirical basis, and it is unaffected by anything above. The millisecond-scale amplitude bulk is core-supplied (the Core-mantle swing), with ice-mass redistribution the proposed mediator between climate and LOD; that mediation remains a hypothesis rather than a result. See doc 102 §“Defensible scientific position” item 7 for the full derivation and Lunar Eclipse Validation §6 for the three-component decomposition of the medieval residual.
When the day got shorter
Run backwards past the validated window, the same stack makes a further out-of-sample claim. During deglaciation the GIA channel reaches its maximum spin-up: the Tidal + GIA baseline bottoms out at ~0.9 ms/cy near 10,600 BC. Stack troughs then push the total rate below zero, in episodes clustered between ~23,000 BC and ~1,300 BC — about 13 % of that span — in which the day transiently shortened. The deepest is −2.0 ms/cy near 8,600 BC, from tidal +2.12, GIA −1.1 and a stack trough of −2.3.
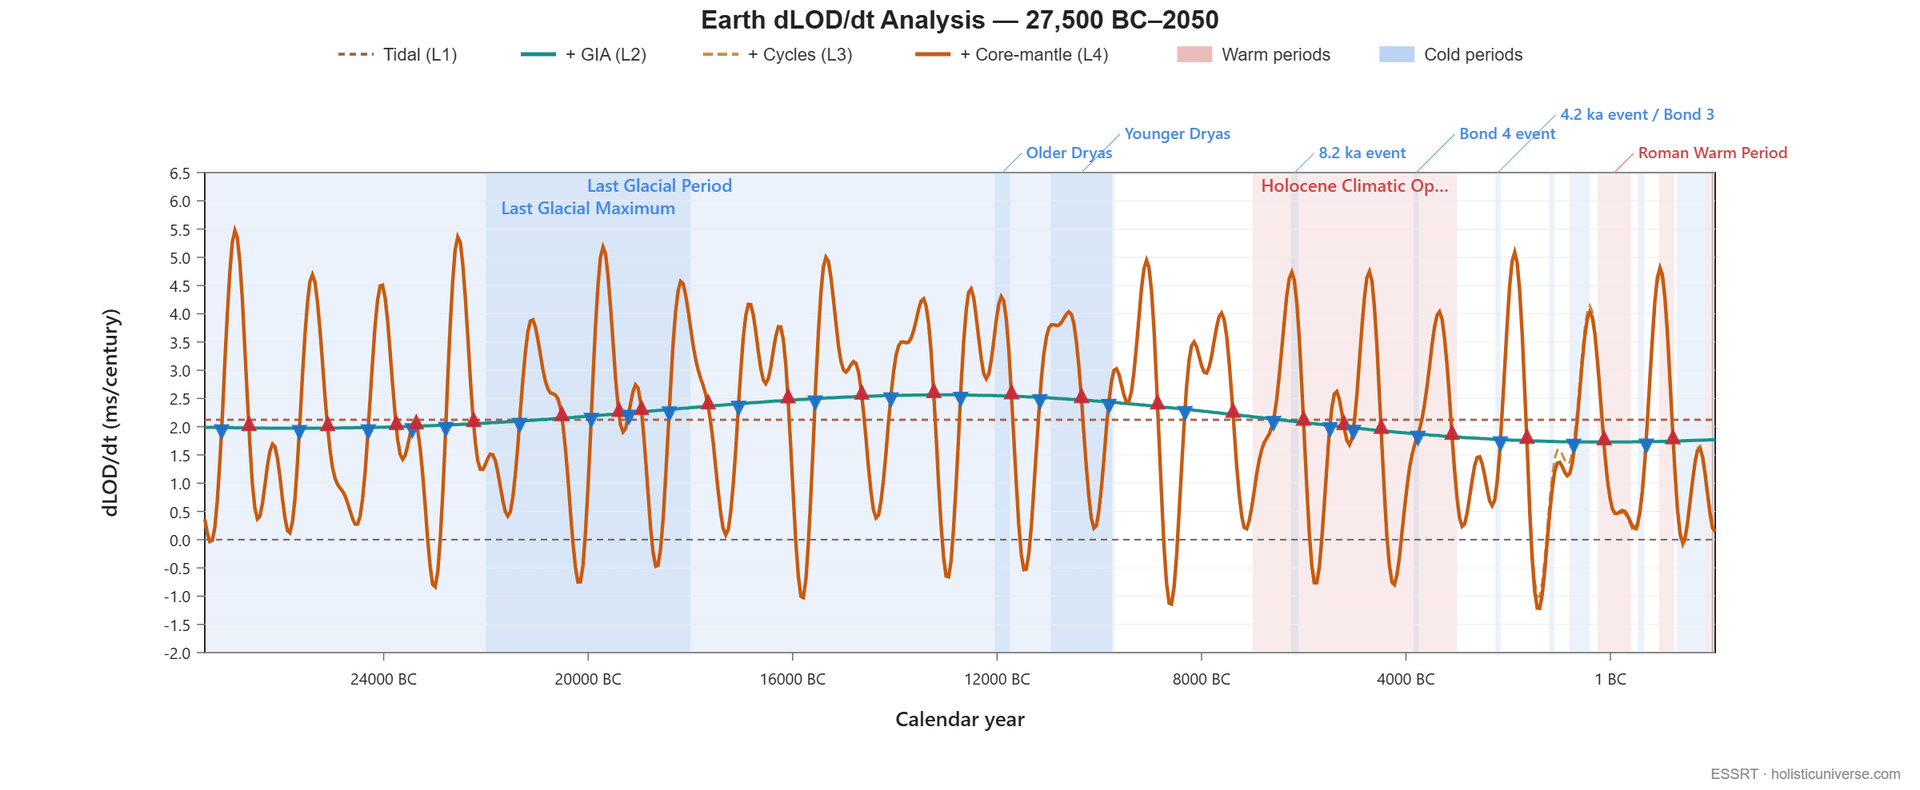
Sign-flipping rotation rates have mainstream precedent on shorter timescales. Earth is in an observed spin-up phase right now (Supporting Evidence §2). Decadal core-mantle angular-momentum exchange regularly turns the rate negative (Holme & de Viron 2013 ), and the troughs of Stephenson 2016’s ~1,500-yr oscillation bring the millennial-mean rate close to zero. A sustained deglacial excursion to −2 ms/cy is not in any mainstream source — it is a framework retrodiction, testable against eclipse-independent Holocene rotation proxies.
A volatility note on the same window. Because the depressed baseline centres the stack swings near zero, the sign of the day’s drift flipped every few centuries through the Older Dryas – Younger Dryas – 8.2 ka sequence. Just before the Younger Dryas that meant swings of ~3 ms/cy within ±250 yr. The rhythm’s periods (~700–1,500 yr) are comparable to the Younger Dryas’ own duration, so this is pacing context, not an explanation — the established meltwater/AMOC mechanism for those events stands.
A leading indicator falls out of the sign structure. The GIA rate term tracks the melting rate — α follows ice volume (more ice ⇒ mantle displaced equatorward ⇒ larger α), so dα/dt ∝ d(ice)/dt and melting drives α down — so the GIA rate’s deepest minima mark deglaciation at maximum speed. It is the minima that carry the information, not the sign: the GIA rate stays negative for millennia after melting ends, because the mantle goes on rebounding (still -0.35 ms/cy at J2000, with the ice sheets long gone). Peak warmth arrives only when melting completes, ~5–10 kyr after those minima (GIA rate minima at ~10,600 BC and ~127,800 BC; LR04 warm peaks follow each — the derivative leads the integral). Since sustained sub-zero dLOD/dt occurs nowhere else in the 200-kyr record, it is a rotation-only marker of a termination in progress: Prediction 6. Causality still runs climate → rotation — the signature is a leading indicator of peak warmth, not a driver.
Deep-time LOD — the secular background
The closed-form formulas on this page describe the millennial cycle around the modern J2000 anchor. Across the much longer timescales of paleoclimate and the Earth-Moon system’s full history, LOD has evolved monotonically with Earth-Moon tidal recession.
Two zoom-outs on the same model
Both views below show the same solar-day-length prediction, just at different scales — the wavy short-term ripple averages out at long-time-scales, leaving the L1 climate signal to dominate.
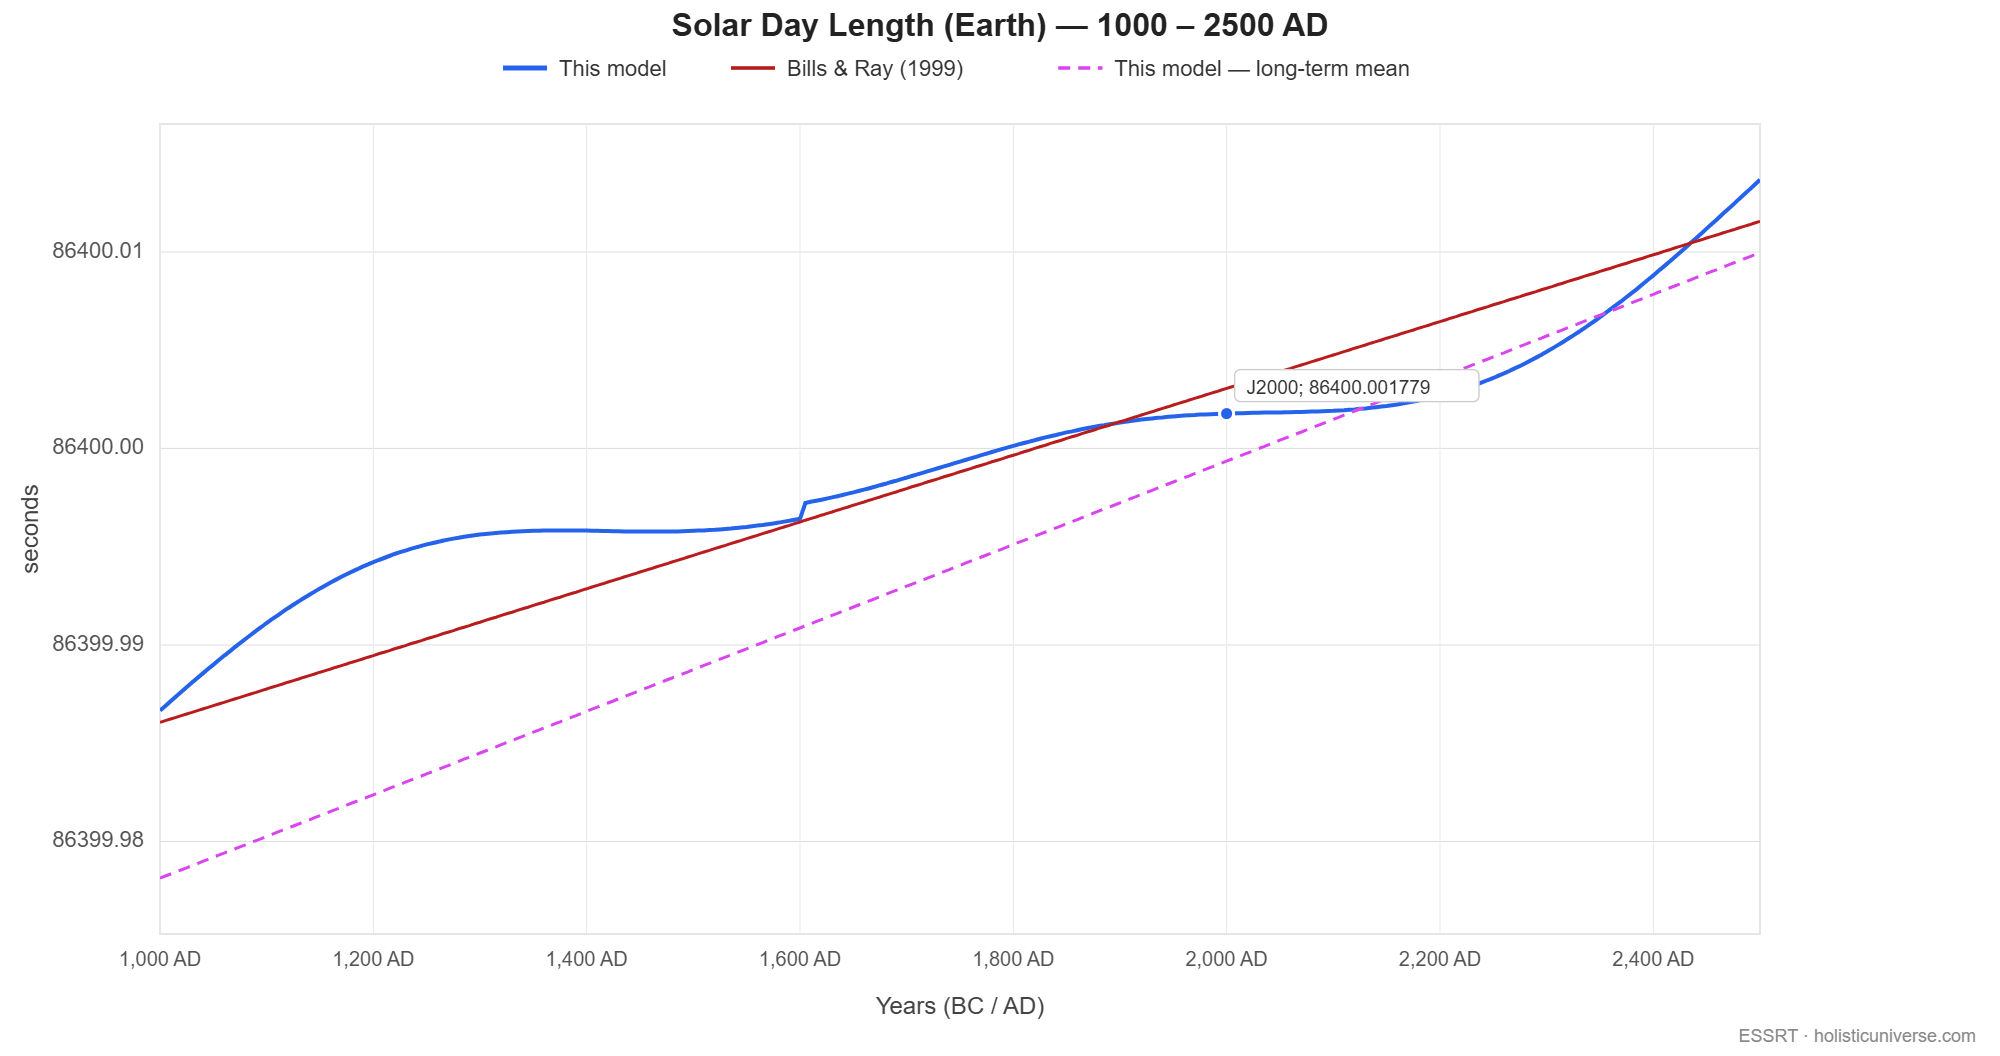
Short-term (±12 kyr from J2000). Model prediction (blue) shows small millennial ripples riding a slow upward trend, hugging its own long-term mean line (dashed purple). Below it, the classical Bills & Ray 1999 linear tidal recession (red) — the extrapolation the mainstream literature uses when no non-tidal channel is modelled. The blue ripples are the four-line correction stack (Bond / Hallstatt / Jose5 / Jose4) plus the Core-mantle swing episode imprinted on top of the pure-tidal trend; the model curve passes through the J2000 anchor at 86,400.0012 s exactly.
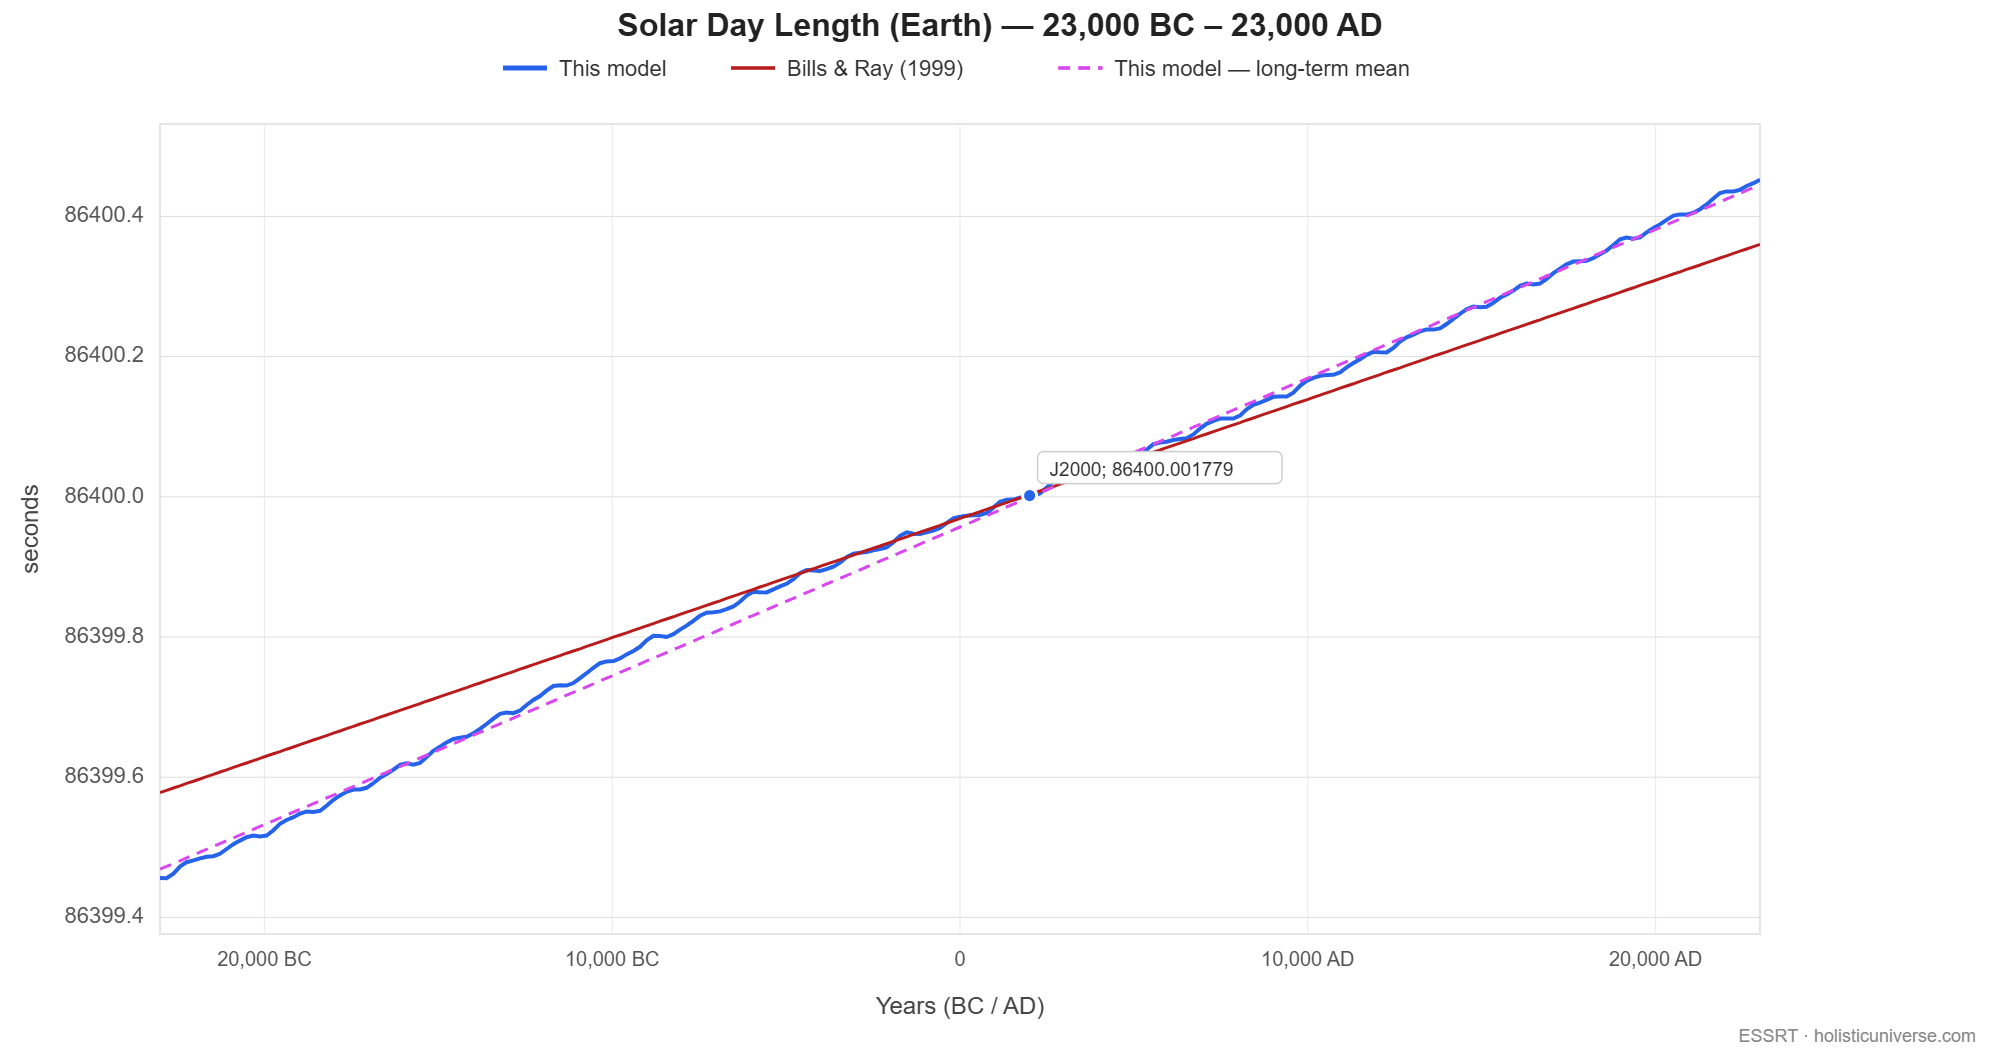
Long-term climate (−248 kyr to +102 kyr). Same model, wider window. The α(t) GIA correction now couples explicitly to the L1 orbital layer of the Climate Formula, producing a ~250 ms peak-to-peak oscillation around the smooth tidal trend. LOD peaks (α max) align with glacial extrema — MIS 6, MIS 2 / LGM; LOD troughs (α min) align with the interglacial peaks — MIS 7e, MIS 5e Eemian, and today’s Holocene near J2000. One mechanism, two observables: the same L1 layer that fits LR04 δ¹⁸O drives both the climate record and the LOD signal, mediated by ice-mass redistribution. The L1 layer serves here as the ice-history proxy, and that is deliberate: it is the in-window description of LR04. Measured against the eclipse-era ΔT, it is the better hindcast of the recent ice history than the model’s own orbital forcing (T7 / WP2 on the climate page). The forward part of the curve is that description extrapolated, not a forecast.
Deep-time epoch values
| Epoch | LOD | Days/year |
|---|---|---|
| Modern (J2000) | 24.00 hr | 365.2421905 |
| Devonian (380 Ma) | ~21.92 hr | 399.96 |
| Earth-Moon genesis (~4.498 Ga) | ~4.62 hr | ~1,886 |
These values come from a proper-physics two-layer LOD formula: a Moon-distance polynomial calibrated against Farhat 2022’s deep-time tidal-evolution data, combined with angular-momentum conservation. The Devonian prediction matches Wells 1963’s coral growth-ring count to within 0.01 % (Supporting Evidence §11). Full derivation and the genesis-at-rigid-Roche self-validation (giant-impact epoch, ~4.498 Ga) are at Expanding Resonance.
Compute ΔT and LOD at any year
The complete closed-form expressions for ΔT and LOD are in Formulas.
Continue to Why Earth Is Special to see how a single timescale organises Earth’s precession periods — and to Moon & Planets for the planetary layer on the model’s own N-body engine.